
In-depth Technical Analysis Confirms Bullish Momentum for GBP/USD Pair – 15/04/2025
Tháng 4 14, 2025
Forex Analysis: EUR/USD Sideways Consolidation Expected to Continue on Hourly Chart – 15/04/2025
Tháng 4 14, 2025Market Overview:
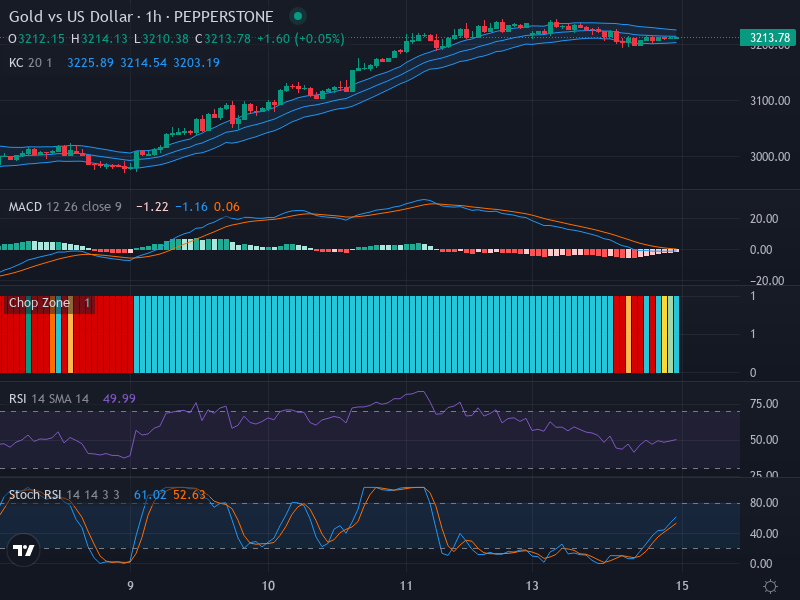
The gold versus US dollar Forex market is presently charting a rather uneventful path, going by the current price of 3213.78. The dominant market direction, as suggested by the clustering of small-bodied candles, favours a sideways movement. This lack of significant breakthrough or break-under underscores the stalemate between market bulls and bears, resulting in an almost flat trajectory for the pair. Insights from this static state of play and the potential next thrilling moments will form the core of our analysis.
Technical Analysis:
A closer examination of the candlestick pattern reveals the absence of notable formations such as engulfing patterns, which signifies the market’s undecisiveness at the moment. Key potential zones identified for this pair are a resistance around the 3225 mark and a support circa the 3200 mark.
An examination of the Relative Strength Index (RSI) paints a similar picture. With the RSI positioned at 49.99, it indicates a neutral market condition lacking robust momentum in either direction. This neutral positioning, in turn, substantiates the current sideways movement.
The Stochastic RSI (Stoch RSI), a momentum indicator, suggests a mildly bullish sentiment on this currency pair. Its K line currently at 61.02 is above the D line at 52.63. Although it suggests an upward momentum, this trend seems to be flirting with neutrality.
This mildly bullish suggestion from the Stoch RSI is somewhat dampened by the MACD insights. The MACD Line stands at -1.22 against the Signal Line’s -1.16, marking a bearish crossover. The slightly negative histogram further flags a weakening in the upward momentum, supporting the conclusion of a sideways trajectory.
Conclusion and Trading Recommendations:
Considering the assorted indicators, the Gold v/s US Dollar Forex market currently lacks decisive momentum and trends sideways. Traders should pay heed to the identified resistance and support zones at 3225 and 3200 respectively. In current conditions, it is advisable to play a wait-and-observe strategy until the market exhibits definitive trend support identifiers like solid RSI, Stoch RSI movement, or MACD crosses.
Trend Analysis:
- 1-Week Time Frame: The market has shown a sideways trend with limited fluctuations, indicating indecision among traders.
- 1-Day Time Frame: Similar behavior with slight fluctuations indicating a possible buildup toward a breakout.
- 4-Hour Time Frame: Minor bullish signals are present, but overall momentum remains weak and indecisive.
Potential Entry Points:
- Buy Entry Point: 3215 | Take Profit Point: 3230 | Stop Loss Point: 3203
- Sell Entry Point: 3200 | Take Profit Point: 3185 | Stop Loss Point: 3210
Given the current analysis, a Buy scenario appears slightly more favorable than a Sell scenario due to the presence of minor bullish signs, but volatility remains a key risk factor. Adjusting strategies based on market developments will be crucial.


