
Florida’s Bold Move Propels Bitcoin to New Heights: What Investors Need to Know
Tháng 4 11, 2025Bitcoin Surges Past $82,000: What’s Driving the Momentum?
Tháng 4 11, 2025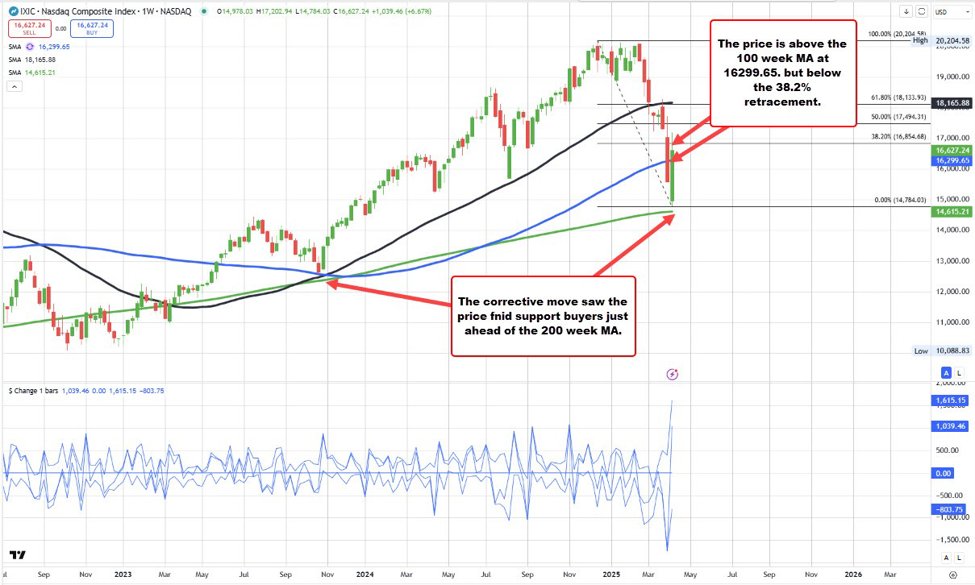
Nasdaq’s Technical Performance: Navigating Key Moving Averages Amid Market Volatility
The recent technical performance of the Nasdaq Composite Index has garnered attention among investors and analysts alike, particularly due to its interactions with crucial moving averages. As traders continue to analyze market trends, understanding the significance of these moving averages can provide valuable insights into the index’s potential trajectory.
Holding Steady at the 200-Week Moving Average
One of the standout features of the Nasdaq’s recent performance is its ability to hold above the 200-week moving average (MA). This moving average is widely regarded as a critical support level for various indices, including the Nasdaq. When an index remains resilient at this level, it often indicates a certain level of durability against external pressures. This steadfastness is particularly noteworthy, considering the broader market faced many challenges, including fluctuating interest rates and geopolitical tensions.
The fact that the Nasdaq has maintained its position above the 200-week MA is a testament to its strength, suggesting that despite the volatility present in the wider market, the index exhibits resilience. Investors often view this performance as a bullish signal, indicating that the index could continue to recover and even thrive, assuming that other factors align positively. For those looking to deepen their understanding of market resilience, here is an insightful article on value investing strategies that can aid in identifying potential bullish trends.
Positive Trend Shift with the 100-Week Moving Average
Adding to the narrative of resilience, the Nasdaq has recently crossed above its 100-week moving average. This upward movement is seen as a harbinger of a positive short-term trend. Achieving this technical milestone can be interpreted as an indication of strengthening momentum within the index, often attracting the attention of both institutional and retail investors.
It’s important to note the significance of crossing above the 100-week MA, as it can suggest a shift in market sentiment toward the Nasdaq. This positive trend shift may provide a welcome counterbalance to the broader market’s wavering sentiment influenced by economic uncertainties. While traders generally approach these signals with cautious optimism, the crossing of this moving average often serves as a timely reminder of the potential for bullish momentum to gain traction. Investors should also be aware of common investment mistakes; this article highlights key pitfalls to avoid, especially during periods of market volatility.
Market Context: Navigating Uncertainty
Despite the encouraging performance of the Nasdaq at these essential moving averages, it is crucial to approach this analysis with an understanding of the larger market context. Currently, concerns surrounding tariffs, inflation, and possible economic downturns loom over major indices, including the S&P 500 and Nasdaq. Both indices have been reported to be approaching a “death cross”, a technical pattern typically characterized by the short-term moving average crossing below the long-term moving average. This phenomenon can signify bearish sentiment and signal potential sustained declines.
Consequently, while the performance of the Nasdaq in relation to its moving averages may appear positive, it operates within a volatile market characterized by uncertainty and expectations of unpredictable movements. Traders and investors alike must remain vigilant, as market conditions can change rapidly, leading to fluctuations in investor sentiment and index performance. Understanding common psychological pitfalls can enhance decision-making during such times; consider reading this article for strategies on maintaining a balanced mindset amid market fluctuations.
Conclusion
In summary, the Nasdaq Composite Index’s recent technical performance, marked by its stability at the 200-week moving average and positive shift above the 100-week moving average, paints a picture of potential resilience. However, the broader market’s volatility poses risks that should not be overlooked. As the financial landscape continues to evolve, monitoring these key technical indicators will be vital for understanding the potential trajectories of the Nasdaq and the wider market. Investors would do well to remain informed and prepared for the uncertainties that lie ahead, as they navigate the complexities of today’s market dynamics.