
Examining the Bearish Sentiment in the Euro vs US Dollar Forex Market – 08/04/2025
Tháng 4 7, 2025
Supreme Court’s Landmark Ruling on Venezuelan Deportation: What It Means for Immigration Policy
Tháng 4 8, 2025Market Overview
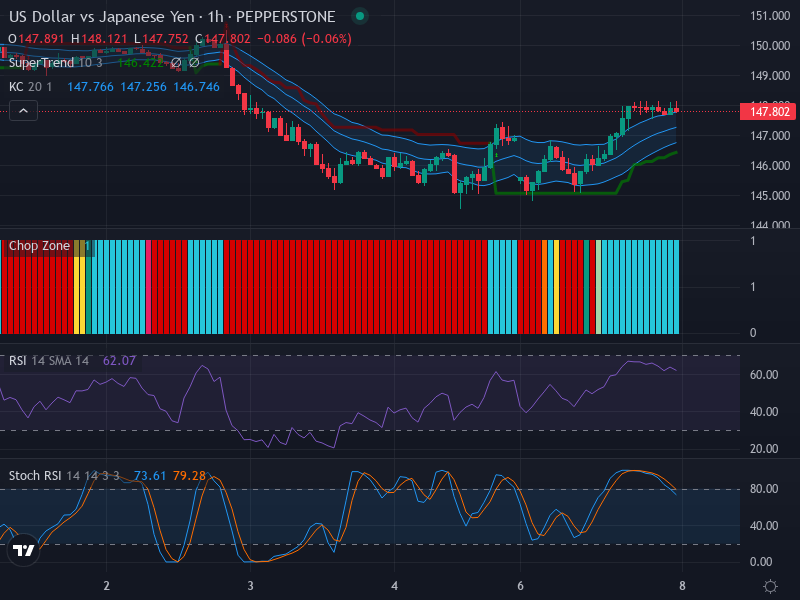
In this article, the primary focus of the discourse will be tailored towards understanding the recent fluctuations in the USD/JPY relationship in the forex market. A close examination of the current market structure reveals a previously dominant downward trend beginning to lose inertia and subsequently transitioning into a lateral market phase. During the past several hours, an interesting pattern has begun to form, which may hint at a critical market development.
Technical Analysis
Considering our candlestick pattern analysis, we can spot a significant occurrence – a bullish engulfing formation. This formation usually signals an enhancement in buying interest, which could further translate into an upward price movement in the coming periods. Notably, the market appears to be settling into a trading range, delineated by potential resistance and support zones at 148.000 and 146.000 levels respectively.
Turning our attention towards the Relative Strength Index (RSI) that currently stands at 62.07, it is important to acknowledge the slightly bullish but neutral market stance it depicts. Although it is inching towards the overbought territory, it does not convey any significant divergences to suggest drastic market changes.
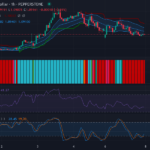
Our examination of additional market predictors such as the Keltner Channels and Chop Zone indicators reveals analogous warnings. The price is nearing the upper band of the Keltner Channels, hinting at potential price resistance. The Chop Zone indicator, meanwhile, employs a predominantly blue reading, signifying a potential turbulent sideways market.
Now on to the Stochastic RSI analysis. The calculated values of K and D lines stand at 73.61 and 79.28, respectively, denoting an imminent arrival in the overbought region. This can mean potential price adjustment downwards, but until the crossover event transpires, the market remains open to interpretations.
Conclusion and Trading Recommendations
Upon examining the most recent market trends on different time frames, it appears that the USD/JPY pair is demonstrating complex dynamics. The market is in a strong uptrend on a 1-week time frame. However, when we scale down to a 1-day period, the trend becomes lateral with a faint bullish inclination. The 4-hour trend, on the other hand, exhibits events of potential trend reversal from the bearish setup to the bullish perspective.
In light of these evolving market configurations, traders should exercise caution and vigilance. It would be prudent to look at the 1-hour chart for possible entry points, closely monitor any potential bullish or bearish crossovers, and consider mitigating risks by setting appropriate stop losses.
Market Trend Summary
- 1-week trend: Strong uptrend indicating bullish momentum.
- 1-day trend: Lateral trend with a slight bullish inclination.
- 4-hour trend: Potential trend reversal from bearish to bullish.
Potential Entry Points and Recommendations
- Buy entry point: 147.500, Take profit point: 148.300, Stop loss point: 147.000.
- Sell entry point: 146.800, Take profit point: 146.100, Stop loss point: 147.200.
After careful consideration of the analysis above, it appears that a Buy scenario is more likely to unfold given the overarching bullish trend evident in the higher time frames. However, traders should remain vigilant due to potential challenges posed by nearing resistance levels.


