
British Pound versus US Dollar: A Comprehensive Hourly Forex Analysis – 09/04/2025
Tháng 4 8, 2025
Gold vs US Dollar: A Comprehensive Technical Analysis Amid Bearish Pressures – 09/04/2025
Tháng 4 8, 2025Market Overview:
The US Dollar versus Canadian Dollar (USD/CAD) exchange rate has recently been reflecting a mix of bullish and bearish movements, driven by various technical indicators in the Forex market. Currently, the trend suggests a state of neutrality, keeping market participants teetering between bullish and bearish sentiments.
Technical Analysis:
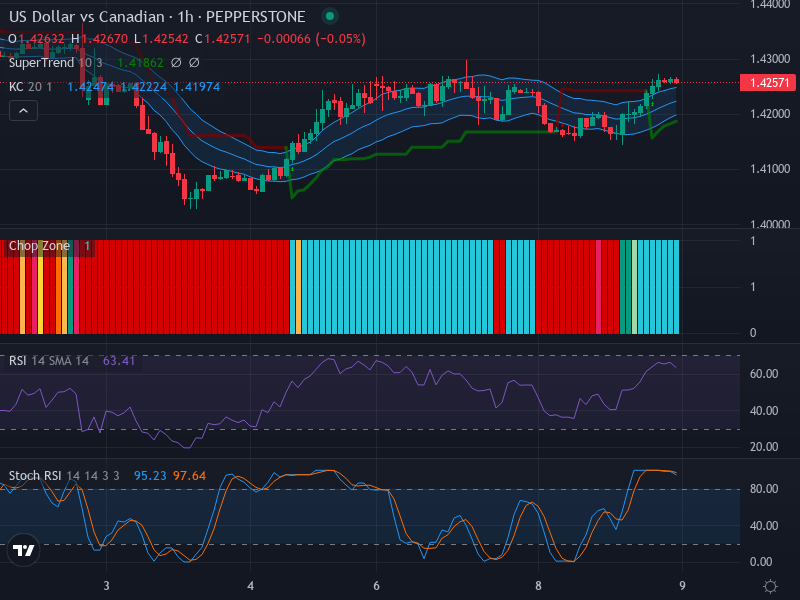
Examining the short-term trend using 1-hour candles, we see a lateral market direction. Notably, the price recently reached the upper band of the Keltner Channel, indicating a resistance level around the current price. This situation limits further upward movement unless the price undertakes a correction.
In this context, price levels possess significant psychological implications. A noteworthy increase in buying pressure could emerge if there is a breakout above the recent high of 1.4275. Conversely, if the price slides below the support level of 1.4200, it may prompt a retracement.
The Relative Strength Index (RSI), which assesses momentum and the speed of price movements, currently registers at 63.41. Typically, an RSI above 70 suggests overbought conditions, hinting at a potential shift from bullish to bearish dynamics. Despite the current RSI supporting bullish sentiment, caution is warranted for those anticipating more upward movement.
Moreover, the Stochastic RSI, another crucial momentum oscillator, also indicates overbought conditions with the K line at 95.23 and the D line at 97.64—both exceeding the overbought threshold of 80. This aligns with the RSI, suggesting the market may soon see a pullback or a consolidation phase. A bearish crossover, where the K line dips below the D line, could herald short-term weakness.
Conclusion and Trading Recommendations:
In analyzing the multi-time frame trends:
- The 1-week trend shows a downward progression with support emerging near recent lows.
- The 1-day trend appears neutral, indicating the price is consolidating within a specific range.
- The 4-hour trend reflects a slight bullish inclination.
In light of this mixed market overview, investors may find it prudent to adopt a ‘wait and see’ strategy until more convincing signals appear.
Trading Entry Points:
For traders considering entry points based on the aforementioned analysis, the following scenarios are suggested:
- Buy Entry Point: 1.4280, Take Profit Point: 1.4350, Stop Loss Point: 1.4200
- Sell Entry Point: 1.4190, Take Profit Point: 1.4120, Stop Loss Point: 1.4250
Ultimately, the current market conditions, alongside the indicators analyzed, point to a more likely Sell scenario, given the overbought signals and potential for a market correction.


