
US Dollar versus Japanese Yen: A Technical Review Amidst Sideways Market Movements – 18/04/2025
Tháng 4 17, 2025Navigating Trade Tensions: Mark Carney’s Strategic Response to U.S. Tariffs
Tháng 4 17, 2025Market Overview
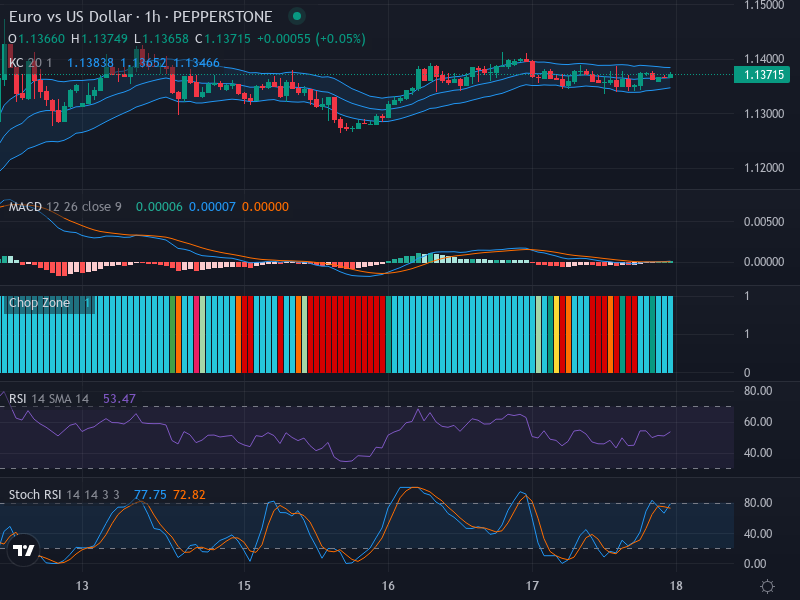
The current market landscape for the EUR/USD pair exhibits a state of relative equilibrium, with an air of indecisive sentiment ruling the scene. At present, the currency pair is trading at approximately 1.13715. Noteworthy is the market’s lateral movement, made evident by small candlestick bodies—signifying short-term consolidation—and reduced price volatility.
Technical Analysis
As we delve into the details, the initial observation of candlestick formation indicates a state of mild consolidation. This factor of small-bodied candles portrays an indecisive market situation, with onlookers awaiting a clear signal before plunging into the market. This sideways oscillation is denoted by a significant support level at 1.1350 and a resistance level at 1.1400, which could act as triggers for potential bullish or bearish shifts, respectively.
Correspondingly, a keen look into the Relative Strength Index (RSI) reveals neutrality with a value of 53.47. This neutral zone emphasizes the wavering market movement, leaving room for possibilities in either direction. The absence of significant divergence also reinforces the ongoing sideways trend.
Complementing the RSI, the Stochastic RSI further elucidates the market mood. A higher ‘K’ line (77.75) than the ‘D’ line (72.82) portrays a mild bullish sentiment in the near term. Nonetheless, investors should tread with caution as it approaches the overbought territory, increasing the risk of a market inversion.
The Moving Average Convergence Divergence (MACD) analysis, on the other hand, portrays a minor bullish crossover despite the shrinking histogram bars which point towards weakening momentum. This finding, in combination with the RSI and Stoch RSI results, suggests a subtle possibility for an upward movement, but with a note of caution.
Finally, via the analysis of Keltner Channels and the Chop Zone, we observe the price flirting near the midline—a potentially critical zone in dictating future movements.
Conclusion and Trading Recommendations
With the current condition, predicting the EUR/USD trend direction is a complex task. The technical analysis reveals a mixed bag of signals, pointing towards minor bullish sentiments but with cautious undertones. It would be prudent for investors to wait for a decisive price breakout or breakdown, either above 1.1400 or below 1.1350, to validate a solid buying or selling opportunity.
Trend Analysis by Time Frame
In analyzing the EUR/USD, we can observe trends across key time frames:
1-Week Trend
The 1-week trend demonstrates overall bullish momentum, as long-term buyers continue to engage, yet recent weeks show signs of consolidation.
1-Day Trend
The 1-day trend exhibits neutrality, with the pair oscillating around its point of resistance and support without definitive direction.
4-Hour Trend
The 4-hour trend suggests a mild bullish bias, driven by short-term traders responding to local highs and lows, though caution is needed due to potential reversals.
Analyzing these trends helps shape our view of entry points:
- Buy Entry Point: 1.1400, Take Profit Point: 1.1440, Stop Loss Point: 1.1370.
- Sell Entry Point: 1.1350, Take Profit Point: 1.1300, Stop Loss Point: 1.1380.
Based on the analysis and current market conditions, a Buy scenario appears more likely to present a significant opportunity given the minor bullish indicators; however, the ongoing market uncertainty cautions against premature decisions.


