
April 29, 2025: Key Economic Events Impacting Global Financial Markets
Tháng 4 29, 2025Spain’s Q1 2025 Economic Outlook: GDP Growth, Unemployment, and Retail Resilience
Tháng 4 29, 2025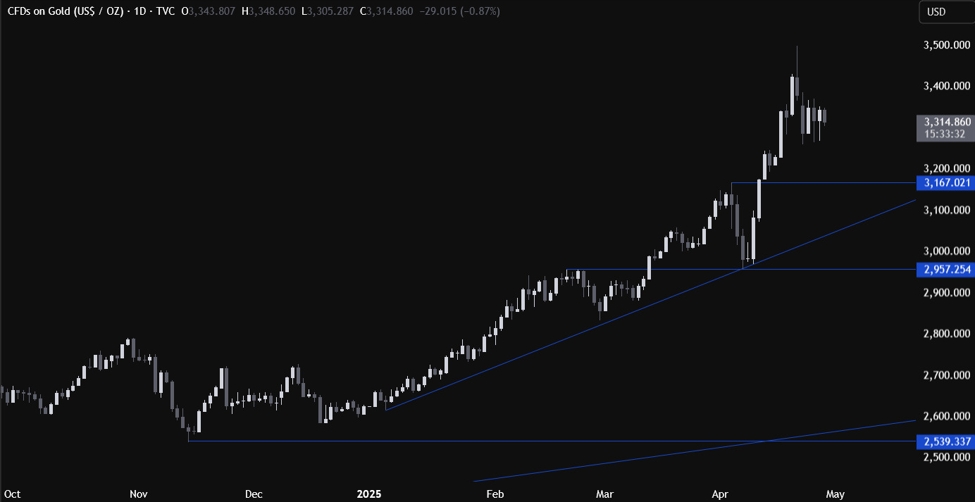
Recent Technical Analysis of Gold: Understanding Price Trends and Market Sentiment
In recent weeks, the price of gold has displayed a distinctive rangebound behavior, making it crucial for traders and investors to carefully analyze market trends and technical indicators. This detailed technical analysis aims to highlight the current price thresholds for gold, explore key support and resistance levels, and provide insights on the market’s anticipated movement.
Gold Price Trends: Navigating Through Critical Ranges
Gold prices are currently oscillating within a well-defined range that holds significant implications for both bullish and bearish market sentiments. A prolonged period of prices above $3,325 could signal a bullish scenario, while a dip below $3,305.5 might evoke a shift toward bearish sentiment. This critical threshold emphasizes the importance of watching psychological price levels that can ultimately determine market direction.
Immediate supports are situated at $3,260 and a more substantial level around $3,200. These support levels are essential for any bullish momentum, as a breach below would likely lead to increased selling pressure. Conversely, resistance levels are observed at $3,300 and $3,370, with a potential upward trajectory towards $3,400 and the noteworthy recent high of $3,500. Breaking through these resistance points may indicate a strong bullish rally, leading traders to reassess their positions based on evolving market dynamics.
Technical Indicators: Gauging Market Sentiment
When examining various technical indicators, the current market exhibits a mixed sentiment landscape. Short-term moving averages are reflecting a strongly bullish trend, particularly in light of the recent corrective movements in gold prices. However, longer-term charts are painting a more cautious picture, suggesting the possibility of a downside break from a rising channel. This dichotomy between short-term optimistic signals and longer-term warning signs illustrates the complexity of the current gold market.
Furthermore, market conditions remain inherently volatile, especially as it approaches pivotal psychological levels like $3,300. Traders are advised to maintain a cautious approach, as abrupt price fluctuations are more likely during specific times, notably early in the week when market liquidity tends to be thinner.
Market Outlook: The Impact of External Factors
With the outlined technical factors in mind, gold’s price action is poised to remain within its current range unless disrupted by significant market events or pivotal economic data. Of particular interest is the anticipated trade deal, which could potentially sway trader sentiment and inadvertently affect gold prices. However, the specifics surrounding such developments remain speculative at this time.
In this regard, understanding broader market dynamics, such as the recent economic initiatives by China, could also play a crucial role in gold price fluctuations. You can read more about China’s initiatives to enhance economic stability amid trade tensions in this article: Three Strategic Moves by China.
In conclusion, as market participants navigate through this rangebound price action of gold, a keen awareness of critical thresholds, support and resistance levels, and external influences will be vital for making informed trading decisions. Whether the market tilts toward bullish or bearish trends will hinge on the unfolding economic landscape and traders’ reactions to these developments. Keeping an eye on technical indicators alongside global economic factors, along with noting key investment mistakes to avoid, will serve as invaluable strategies for those seeking to capitalize on the fluctuating nature of gold prices. For more insights on avoiding common investment pitfalls, check out this guide: Top Investment Mistakes to Avoid for 2023.