
Sideways Sentiment Lingers for EUR/USD: A Comprehensive Technical Analysis – 10/04/2025
Tháng 4 9, 2025
A Comprehensive Technical Analysis: Gold vs US Dollar (1h) – PEPPERSTONE – 10/04/2025
Tháng 4 9, 2025Market Overview:
The British Pound (GBP) against the US Dollar (USD) currently presents an intriguing tapestry of lateral market action as the price oscillates within central bounds, suggesting a period of relative stability. In a situation where the market trends sideways, traders and investors should be prepared for any surprising twists and turns that could potentially occur around key price levels.
Technical Analysis:
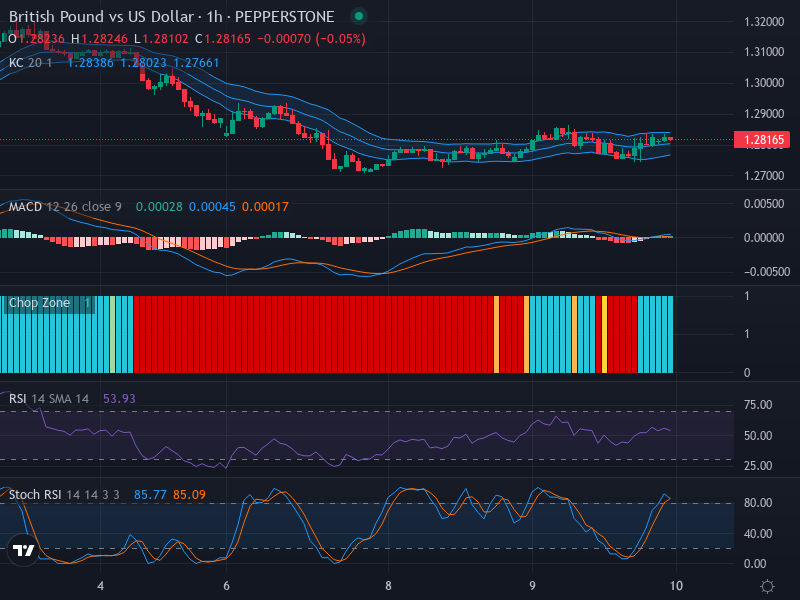
Examining the candlestick patterns of the GBP/USD, the present movements appear to be largely sideways with shifts oscillating around the middle of the Keltner Channel. This lateral market activity springs from the lack of any significant bullish or bearish patterns such as engulfing or doji formations that might otherwise signal strong reversals or continuations.
The Relative Strength Index (RSI), sitting at a neutral value of 53.93, further supports this sideways movement. Neither overbought nor oversold conditions are indicated at this stage, and there are no notable divergences visible between the RSI values and price fluctuations, suggesting an alignment with the existing price trend.
Fascinatingly, the Stochastic RSI (Stoch RSI) shows a different scenario. With the Stoch RSI ‘K’ value at 85.77 and ‘D’ at 85.09, there’s a clear indication of an overbought condition in the market. This situation could potentially see a downward movement as it counters the prevailing lateral trend, highlighting a subtle contradiction in the market behavior.
In concert with this, the Moving Average Convergence Divergence (MACD) line stands at 0.00028 while the signal line reads 0.00045. The absence of a crossover at this point underscores a non-committal market direction, reinforcing the perception of a stagnant market tone.
Two key inflection points to monitor in the present landscape are at 1.27800 (support) and 1.28500 (resistance). Market watchers should brace for possible price surges or retracements happening around these levels.
Conclusion and Trading Recommendations:
In light of the observations from this comprehensive analysis, the GBP/USD currency pair portrays a phase of sideways movement with an overbought condition hinted at by the Stochastic RSI. A cautious approach is recommended during these times of uncertainty.
A lack of clear buy/sell indications necessitates prudent monitoring of key levels, particularly around 1.27800 and 1.28500, where price action could potentially turn unexpectedly.
1-Week, 1-Day, and 4-Hour Trend Analysis:
The analysis over the different time frames presents the following:
- 1-Week Trend: Lateral movement prevails with consolidation around pivotal levels, indicating indecisiveness in the long-term market direction.
- 1-Day Trend: The price remains range-bound, failing to exhibit strong trends in either direction, supporting the overall lateral market sentiment.
- 4-Hour Trend: Short-term oscillations around resistance and support levels suggest traders should remain vigilant for breakouts or reversals.
From this comprehensive analysis, potential entry points are as follows:
- Buy Entry Point: 1.28150, Take Profit Point: 1.28700, Stop Loss Point: 1.27500
- Sell Entry Point: 1.27900, Take Profit Point: 1.27300, Stop Loss Point: 1.28300
Considering the overall market conditions and the insights from the technical indicators, a Sell scenario seems more likely in the short term due to the overbought indication from Stochastic RSI while maintaining awareness of key support and resistance levels.


