
Navigating Economic Turbulence: The Dangers of Proposed 100% Tariffs on Overseas Movies
Tháng 5 4, 2025Navigating the U.S.-China Trade Tensions: Key Insights on Tariffs and Future Strategies
Tháng 5 4, 2025Market Overview:
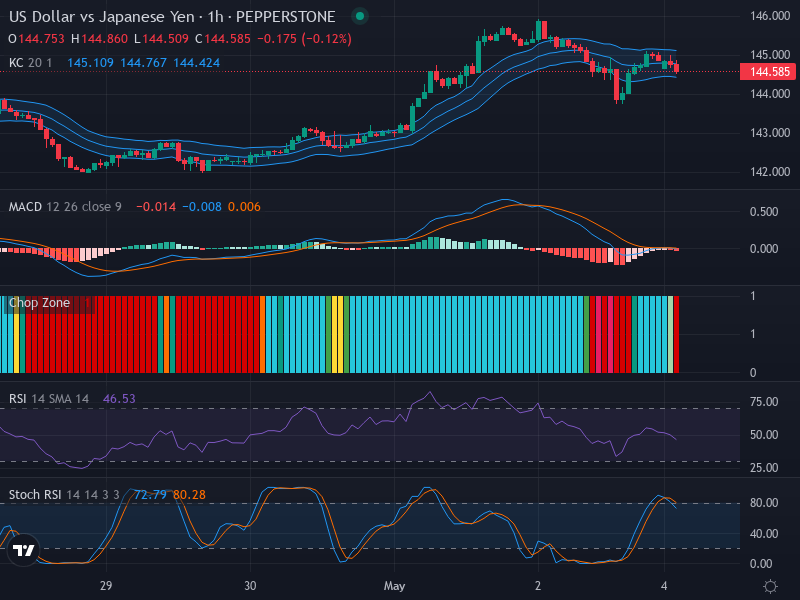
The USD/JPY market appears to be transitioning from an upward movement into a phase of consolidation, exhibiting minor lateral trading. No obvious directionality has been observed through the recent candlestick patterns. However, markets could test support or resistance zones at 144 and 145.5, respectively, depending on the ongoing price action.
Technical Analysis:
Candlestick Pattern Analysis:
Despite the absence of decisive market signals, such as bullish engulfing or hammer patterns, the appearance of doji-like candles often signifies market indecisiveness, a typical feature during price consolidation. Market participants would be wise to monitor how the price unfolds at significant levels – 145.5 and 144.
Relative Strength Index (RSI) Insights:
The RSI, currently at 46.53, resides more or less in the neutral zone, hinting at a minor tilt towards the oversold condition. This suggests that selling pressure may diminish momentarily. Moreover, there is a conspicuous lack of bullish or bearish divergence from the navigation of the RSI, indicating synchronicity with the price action.
Interpretation of Keltner Channels and Chop Zone:
The USD/JPY currency pair is currently hesitating around the Keltner Channel’s median, a further testament to its sideways movement. Moreover, the moderate expansion of the channels hints at decreased market volatility in the near term.
The Chop Zone analysis reaffirms this stance, with the continual coloring of bars indicative of a market lacking a conclusive trend.
Stochastic RSI Examination:
The stochastic RSI has yet to be analyzed at present and might offer more insights into future price action.
Conclusion and Trading Recommendations:
Given the ongoing consolidation phase and neutral indicators, traders might want to adopt a wait-and-see approach for the USD/JPY pair until more definitive signs emerge. Keen eyes on the support and resistance at 144 and 145.5 might present profitable opportunities, depending on market reaction at these levels.
Analyzing the 1-week, 1-day, and 4-hour timeframes yields the following insights:
- 1-week timeframe: Shows a lack of clear direction, maintaining a neutral outlook with potential for a breakout above resistance at 145.5.
- 1-day timeframe: Signals consolidation with sideways movement, yet maintaining a bias towards a bullish continuation on a break above 145.5.
- 4-hour timeframe: Reflects low volatility and consolidation, indicating that tighter range trading is likely until a significant event drives price upwards.
From this analysis on multiple timeframes, potential entry points for traders at the 1-hour timeframe are as follows:
- Buy entry point: 145.3, Take profit point: 146, Stop loss point: 144.5.
- Sell entry point: 144.5, Take profit point: 144, Stop loss point: 145.
In conclusion, the analysis suggests that a Buy scenario is more likely to occur, especially if the price breaks above the resistance at 145.5.


