
Analyzing Bearish Momentum in the USD/CAD Forex Market – 11/04/2025
Tháng 4 10, 2025
GBP/USD Pair Sustains Bullish Momentum: A Comprehensive Analysis – 11/04/2025
Tháng 4 10, 2025Market Overview
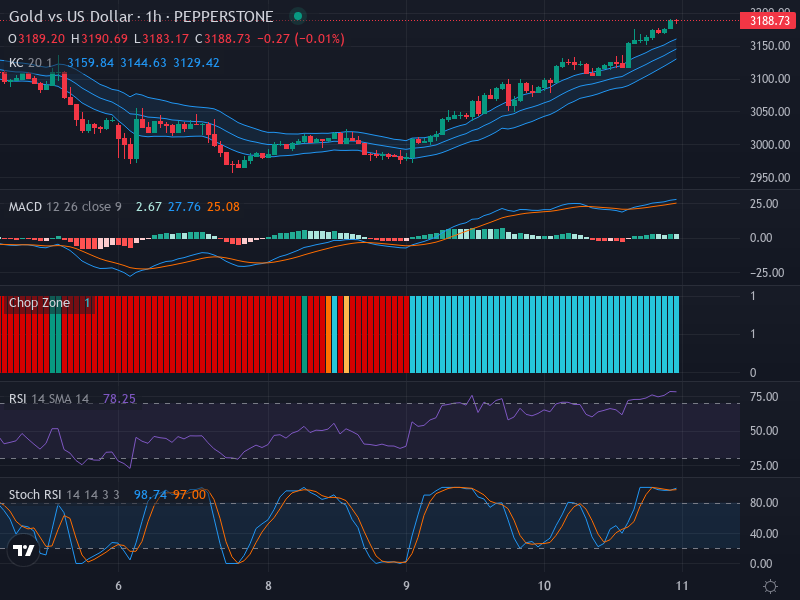
The latest Forex data points to a compelling bullish trend for Gold against the US Dollar on the one-hour chart. This upward trajectory is evident, but current conditions suggest the market may be overbought, potentially leading to a brief consolidation or retracement near 3160. In the arena of financial markets, foresight and prudence are invaluable. This article provides an in-depth technical analysis of the current scenario and offers strategic insights for traders.
Technical Analysis
The market direction is evidently upward as seen from the strong upward candlestick formation. Recent candles testify to the robustness of this upward thrust, serving as a testament to the market’s bullish sentiment. However, wise traders are aware that markets do not move in a single direction indefinitely. A potential retracement or consolidation could occur near the 3160 mark, especially if a reversal pattern emerges.
Currently, the Relative Strength Index (RSI) values stand at 78.25, indicating a stark overbought scenario. Conditions like these often hint at an impending pullback or consolidation, offering a potential pivot point in market dynamics. However, there’s no clear divergence between the RSI and the price movement, which allows room for Caution with further upward movement.
The Stochastic RSI indicators also suggest an overbought status quo. The values for K and D stand at 98.74 and 97.00, respectively. Together, these figures point to a high probability of a near-term correction. While a Stochastic RSI crossover hasn’t manifested yet, one might be on the horizon, highlighting the potential for price action changes.
Couple this with the Moving Average Convergence Divergence (MACD) analysis, and the narrative becomes more intriguing. With a MACD line at 27.67, towering over the signal line at 25.08, the bullish crossover supports the prevailing upward momentum. The MACD histogram’s momentum, which is currently on the rise, further enhances this bullish sentiment.
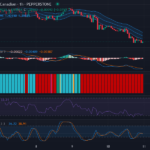
Analyzing the Keltner Channels and Chop Zone, it is noticeable that the price is trending above the middle line. This tendency is suggestive of a strong bullish market.
Conclusion and Trading Recommendations
The gold-to-dollar relationship is moving in a decidedly upward direction, as affirmed by the strong upward candlestick formations. However, overbought conditions indicated by RSI and Stochastic RSI reveal the possibility of a near-term pullback or consolidation, particularly around the 3160 mark. Given the current observations, traders should closely monitor this pair for potential retracement signs or consolidation.
1-Week Trend: The overall trend appears bullish, yet there are signs of exhaustion. Price may face resistance near previous highs.
1-Day Trend: The daily chart’s indicators suggest continued bullish momentum, albeit with some caution given the overbought readings.
4-Hour Trend: Short-term fluctuations are likely as traders take profit from recent gains, indicating potential volatility in the coming sessions.
In terms of entry points:
- Buy Entry Point: 3160; Take Profit Point: 3190; Stop Loss Point: 3140.
- Sell Entry Point: 3200; Take Profit Point: 3170; Stop Loss Point: 3210.
Considering the analysis, a Buy scenario appears more likely given the current bullish momentum, but traders should prepare for possible retracements.


