
Upward Journey Continues for USD/CAD Despite Overbought Signals – 16/04/2025
Tháng 4 15, 2025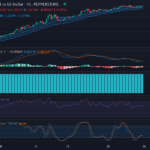
In-Depth Look into the Bullish Momentum of GBP/USD: A Forex Market Research – 16/04/2025
Tháng 4 15, 2025Market Overview
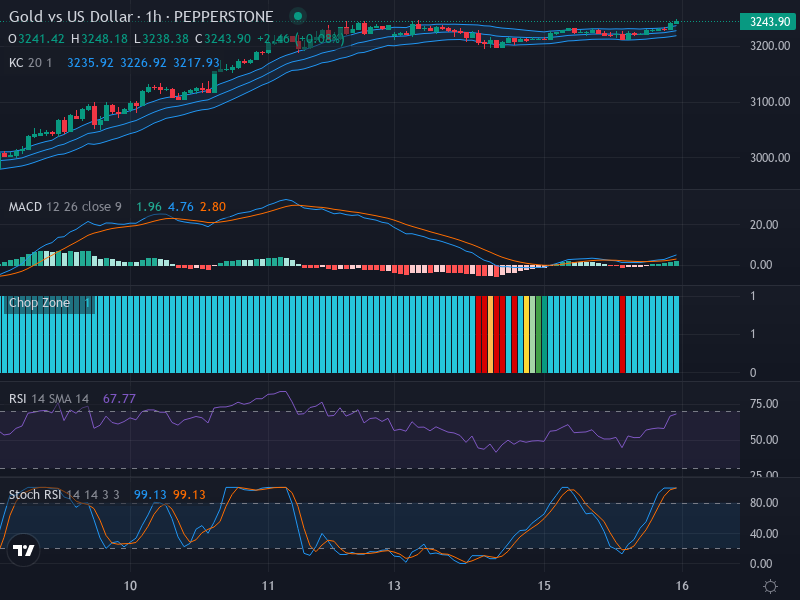
The Gold to US Dollar (XAU/USD) currency pair is currently on a strong bullish upward trajectory. This current surge, which has seen prices breakout above the Keltner Channel, indicates there is potential for further price expansion in this bullish environment. However, indicators are beginning to show overbought signals, prompting traders to exercise caution and vigilance in their trading decisions.
Technical Analysis
Recent price action illustrates an ongoing upward trend, supported by a series of bullish candles. The breakout above the Keltner Channel suggests a robust bullish sentiment, yet traders should remain alert to the possibility of a retracement near the 3260 level if the bullish momentum begins to wane.
The Relative Strength Index (RSI), currently at 67.77, is edging towards the overbought threshold, serving as a warning that the market may experience a pullback. Importantly, the absence of significant RSI divergence reinforces the strength of the current trend.
The Stochastic RSI indicates a potentially overheated market, as both K line and D line have entered overbought territory. This suggests that a short-term price correction could occur if the bullish energy loses steam.
Further inspection of the Moving Average Convergence Divergence (MACD) shows the MACD line at 1.96 and the signal line at 4.76, indicating a bearish crossover that points toward the likelihood of a temporary pullback. Additionally, a declining MACD Histogram reveals that momentum may be reaching its peak, raising caution among those anticipating uninterrupted bullish movement.
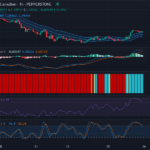
In terms of the Keltner Channels and Chop Zone indicators, the price remains well above the middle band, reinforcing a general bullish bias. However, the ongoing coloration of the Chop Zone hints at a sideways market phase, suggesting that a significant breakout could be on the horizon.
Conclusion and Trading Recommendations
Given the integrated analysis of the prevailing technical indicators, the market exhibits a combination of strong bullish sentiment alongside indications of potential pullback. Investors are advised to meticulously monitor market activity, particularly for signs of retracement near the 3260 mark should the bullish momentum falter. Traders should be mindful of fluctuations in momentum and price action to adjust their strategies accordingly.
In summary, the next steps for traders are to formulate clear trading actions based on this analysis. While a bullish trend is still plausible, the presence of overbought signals strongly suggests the need for readiness regarding any potential pullbacks.
Trend Analysis
- 1-week timeframe shows a predominantly bullish trend with strong support levels indicated by sustained buying pressure.
- 1-day timeframe reflects mixed signals suggesting possible consolidation as overbought conditions are noted.
- 4-hour timeframe indicates a potential reversal with bearish indicators emerging alongside price hesitance.
Potential Entry Points
- Buy Entry Point: 3270, Take Profit Point: 3310, Stop Loss Point: 3250.
- Sell Entry Point: 3240, Take Profit Point: 3200, Stop Loss Point: 3260.
In light of the analysis, a Buy scenario appears more likely due to the prevailing bullish momentum, despite caution on overbought conditions and the potential for short-term corrections.


