## Market Overview
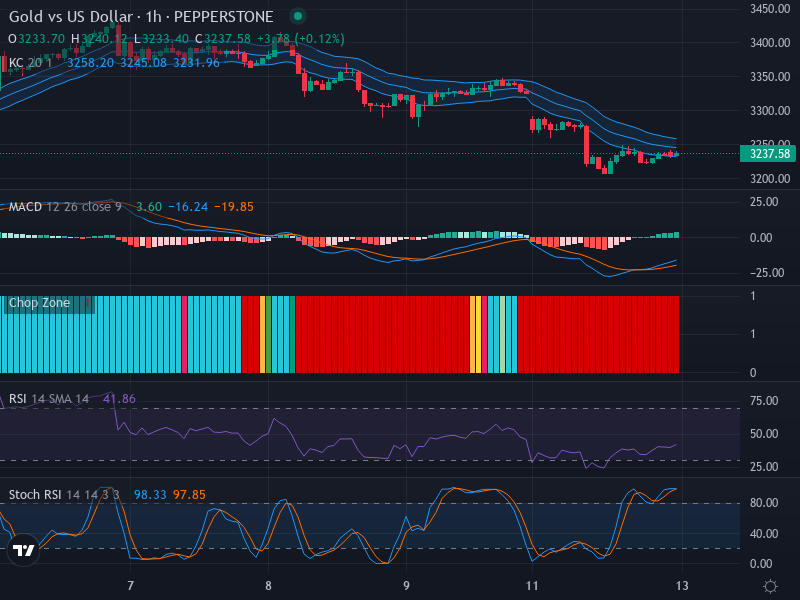
The Gold vs US Dollar pair finds itself in a **bearish wave**, as evidenced by a consistent trend of **lower highs** and **lower lows** in its trading pattern. Even though gold is a highly sought-after asset, it fails to show a climbing trend against the greenback, and the market sentiment leans mostly towards more **[bearish movements](https://eatrading.ai/neutral-undertones-shaping-the-short-term-market-outlook-for-usd-cad-28-03-2025/)**.
## Technical Analysis
In terms of **candlestick patterns**, the Gold vs US Dollar pair reveals a dominant **downward trend** with an absence of any notable **[bullish reversal patterns](https://eatrading.ai/a-neutral-tide-in-the-gbp-usd-current-key-technical-notes-and-strategies-28-03-2025/)** such as hammers or bullish engulfings. This paints a clear picture that the bearish sentiment continues to strong-arm this pair, vividly indicating a **lower market tendency**.
Peeking into the pair's **retracement zones** defined by the **Keltner Channel**, we identify markers between **3245-3250** where potential retracements could occur before the bearish trend continues its course. These zones might serve as key areas to watch for those looking to jump in on the downward trend.
Moving ahead to the **Relative Strength Index (RSI)**, this leading indicator presents a value of **41.86**, bordering towards the **oversold territory**. This backs the bearish sentiment, suggesting that the pair may continue to slide downwards. With no distinct **divergence** apparent on the RSI, the lack of a reversal indication reinforces the downward projection.
However, a counter-argument surfaces when delving into the **Stochastic RSI**. Both K (**98.33**) and D (**97.85**) lines suggest a state of **overbought conditions**. While this appears to contradict the dominant bearish trend, it might signal a short-lived **corrective phase** or minor pullback.
The **Moving Average Convergence Divergence (MACD)** completes our analysis with a surprising twist. Despite the recent **[bullish crossover](https://eatrading.ai/euro-vs-us-dollar-forex-analysis-identifying-the-bullish-momentum-amid-consolidation-28-03-2025/)**, the rapidly weakening momentum mirrored by the MACD histogram hints at the prospect of bears regaining control soon.
## Conclusion and Trading Recommendations
In conclusion, the Gold vs US Dollar is tightly gripped by a downward trend. The presence of potential retracements and minor corrections alluded to by the Stochastic RSI and MACD should not divert from the dominant bearish outlook. Therefore, selling opportunities could be desirable, targeting pullbacks towards the middle band of the Keltner Channel between **3245-3250**.
Based on the analysis:
- **1-week trend**: The bearish trend persists with continuous lower highs and lows.
- **1-day trend**: Volatility hints at short-term corrections, but the longer trend remains bearish.
- **4-hour trend**: Minor pullbacks are observed, but they do not alter the overarching downward momentum.
Potential **entry points** based on the analyses suggest that a **buy** entry could be observed at **3250**, with a **take profit** at **3265** and a **stop loss** at **3240**. A potential **sell** entry could be placed at **3245**, with a **take profit** at **3230** and a **stop loss** at **3255**. Given the prevailing conditions, the **sell scenario** appears more likely to succeed than a buy scenario.
## Risk Disclaimer
Please note, this market research is only indicative of potential market moves and should not be considered as definitive advice. Financial market investments always carry potential risks, and past performance does not guarantee future results. Therefore, it is recommended that traders maintain a sound **risk management strategy** when trading in the forex market.