
Bullish Signals Emerge from USD/JPY amidst Current Downward Trend – 26/05/2025
Tháng 5 25, 2025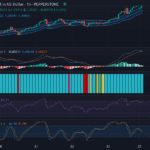
GBP/USD Trade Analysis: Steady Uptrend Meets Potential Resistance – 26/05/2025
Tháng 5 25, 2025Market Overview
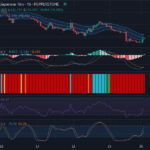
At the current price of 3343.89, Gold against the US Dollar appears to be undergoing a period of bearish momentum according to the most recent analysis on the 1-hour chart. Despite the market predominantly showcasing lateral movement, there is latent risk of the downtrend prolonging. This analysis aims to delineate whether we might see a surge around 3350 or a possible retracement near the 3320 mark.
Technical Analysis
In the overarching interpretation of the candlestick pattern, a series of smaller red candles is indicative of increased sell-offs suggesting bearish momentum. This momentum, coupled with the broader trend of lateral movement, alerts for a potential downward continuation if the sell pressure persists.
The Relative Strength Index (RSI), which stands neutral at a value of 54.06, further confirms the balance in the current market between buyers and sellers. There are neither overbought nor oversold conditions, and more importantly, the RSI isn’t illustrating any significant divergence with the price to show an oncoming reversal. This is harmonious with the current sideways trend reflected in the chart.
An examination of the Keltner Channels and the Chop Zone Indicators provides a more nuanced picture. With the price lingering marginally above the middle band of the EMA 20 Keltner Channel, we can discern a faint upward trend. Although the channels are moderately expanded implying a certain degree of volatility, the current market scenario’s low volatility and sideways trends are reconfirmed through the continuous turquoise presence in the Chop Zone. No considerable breakout signals have been detected, warranting caution in the near term.
The Stochastic RSI (Stoch RSI) further asserts neutrality, transpiring from the positions of the K Line at 13.93 and the D Line at 23.65.

Conclusion and Trading Recommendations
The analysed factors collectively denote an ambiguous market trend for Gold against the US Dollar. With bearish momentum, coupled with the market’s consistent sideways movement and a negligible rise, it’s recommended for traders to adopt a cautious stance. A decisive move could materialize once the price crosses the potential surge zone at 3350 or drops and retraces near 3320. Therefore, it is advisable to wait for more concrete signals before making a trading decision.
Additional Trading Insights
Analyzing the 1-week, 1-day, and 4-hour time frames presents the following trends:
- The 1-week time frame shows a slight bearish trend but indicates potential support at previous lows.
- The 1-day time frame reflects a consolidation pattern, suggesting indecision in the market.
- The 4-hour time frame reinforces the bearish momentum with lower highs being formed, indicating continued selling pressure.
Based on this comprehensive analysis, potential entry points in the 1-hour time frame are as follows:
- Buy Entry Point: 3350; Take Profit Point: 3380; Stop Loss Point: 3330.
- Sell Entry Point: 3320; Take Profit Point: 3300; Stop Loss Point: 3340.
Given the current analysis, a Sell scenario appears more likely due to the prevailing bearish momentum and the lack of concrete bullish signals.


