
USD/JPY Technical Analysis – A Pending Reversal amidst Downward Trend? – 07/04/2025
Tháng 4 6, 2025
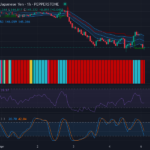
Navigating the Storm: Nikkei 225 Hits 8-Month Low Amid U.S. Tariff Turmoil
Tháng 4 7, 2025Market Overview:
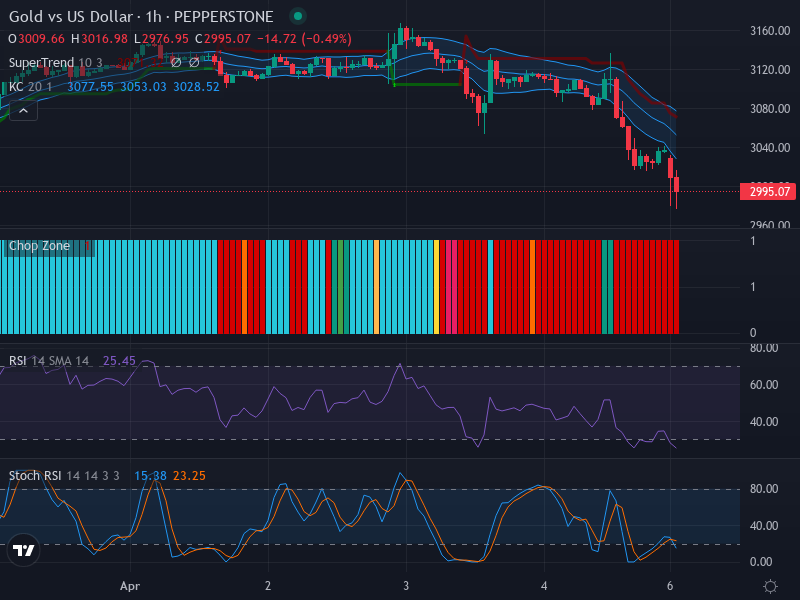
The currency pair of gold versus the US dollar has been under the scanner lately, with market trends indicating a distinctly bearish tone. The currency pair is caught in a downward spiral, signaled by a series of red candlesticks that denote the sustained selling pressure. Despite this, the pair has shown some signs that could imply potential periods of short-term retracement or consolidation.
Technical Analysis:
In the illustrated chart, it is noted that the price currently rests below the middle band of the Keltner Channels, which further reiterates the prevailing bearish sentiment. Despite this consistent slump, we need to acknowledge that markets are often characterized by cyclical ups and downs. This brings us to the ‘support zone’. It appears to be hovering around previous lows of around 2980, marking a critical point where one might expect to see the currency pair rebound.
Analyzing through the lens of the Relative Strength Index (RSI), we identify an oversold condition with the RSI deep in the trenches, reading at 25.45. In layman’s terms, the sharp spike in sell-offs has tipped the scales, implying that the asset may be undervalued and that a corrective rally might be on the cards. However, aligning with the bearish climate, we fail to see any noticeable divergence between the RSI and the price action.
Intriguingly, the Stochastic RSI throws up an interesting observation. Both its K-line (15.38) and D-line (23.25) show evidence of overselling. A potential crossover of the K-line over the D-line, while still remaining unconfirmed, could be a signal of a short-term recovery. This would add an opposing force to the prevailing bearish tide and may contribute to price stabilization, at least temporarily.
Indicative of the long-term bearish trend, we see the currency pair’s price remaining beneath the EMA 20 middle band. The Chop Zone, too, substantiates this with a set of red bars, speaking volumes about the strength observed in the current trending market.
Conclusion and Trading Recommendations:
In the light of the above analyzation, the speculative jitters in the market may lead to an oscillation between periods of heavy selling and temporary pullbacks. This sets us in a tricky bout of the cascading bearish trend and the emerging short-term bullish potential.
Using this for trading recommendations, investors are suggested to maintain a cautious approach. Considerable bearish momentum and continued selling pressure indicate that short positions may be preferable at their discretion. However, keeping in mind the oversold conditions and potential short-term bullish signals, catching the right moment of upward retracement for buying opportunities could also be worthwhile. Continual monitoring of the discussed indicators will be pivotal in this regard.
1-Week Trend: The long-term bearish sentiment remains intact with consistent lower lows.
1-Day Trend: A potential short-term consolidation could lead to upward price movements but remains vulnerable to selling pressure.
4-Hour Trend: Continued bearish momentum persists, with oversold conditions signaling possible short-term recovery.
Based on the analysis and examination of the current trends, potential entry points are as follows:
- Buy Entry Point: 2985, Take Profit: 3010, Stop Loss: 2960.
- Sell Entry Point: 2975, Take Profit: 2950, Stop Loss: 2990.
In conclusion, while a potential short-term bullish scenario is emerging, the overall market sentiment leans towards bearishness, suggesting that a Sell scenario may be more likely.


