
A Closer Look into the Subtle Bulls of the USD/CAD Market – 28/04/2025
Tháng 4 27, 2025
Sideways Tension in GBP/USD: A Detailed Forex Market Analysis – 28/04/2025
Tháng 4 27, 2025Market Overview
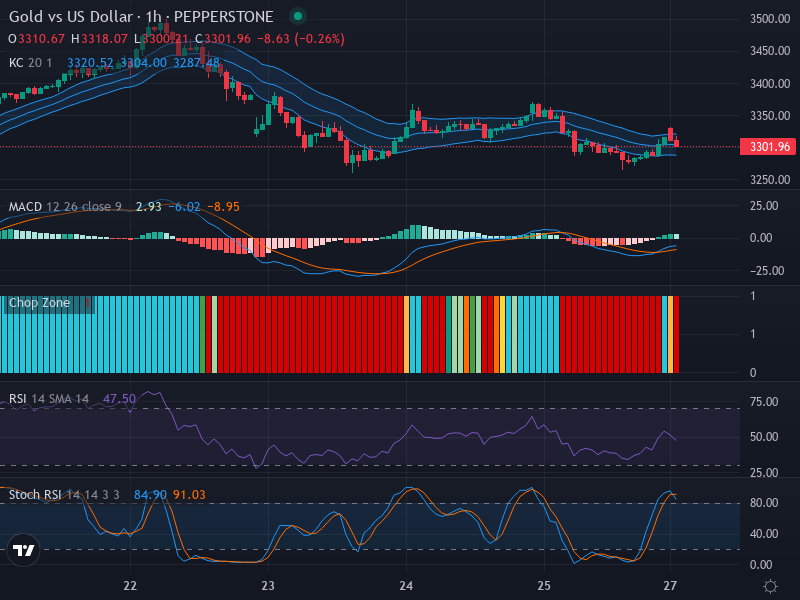
The Gold vs US Dollar forex pair sheds light on a highly volatile market scenario. Currently priced at 3301.96, the pair is exhibiting a dominant downward trend, characterized by a series of lower highs and lower lows. However, the market’s recent bullish bodies do hint at a possible trend reversal, making the path forward somewhat uncertain.
Technical Analysis
Delving into the candlestick patterns, the market has revealed possible reversal patterns. A few recent bullish candles have contradicted the prevailing bearish momentum, indicating potential resistance. This reveals the strength of the bulls, who, despite an ongoing downward market, have managed to lay the groundwork for a bullish fightback.
Key support and resistance zones are around the 3280 and 3320 levels respectively. The presence of these retracement levels may create a buffer against further price drops while providing upward momentum for the price if breached effectively.
As for the Relative Strength Index (RSI), the value stood at 47.50, indicating a neutral ground. This suggests that the market is neither overbought nor oversold, leading to a cautious outlook. The RSI does not display any discernible divergence with the price movement, reinforcing the watchful approach for traders.
The Stochastic RSI presents an interesting picture. Both K-Line (84.90) and D-Line (91.03) are located in the overbought region. Potential crossovers here could fuel the ongoing downward motion while hinting at weakening bullish momentum.
Aligning these insights with the Keltner Channels indicator, the situation seems slightly biased towards bearish sentiments. The price movement around the middle band of the Keltner Channels coupled with a neutral to slightly bearish long-term trend confirms this expectation. The volatility within this pair has been moderate, indicated by the varying yet moderate channel width.
Conclusion and Trading Recommendations
Given the downward market trend, coupled with an overbought Stochastic RSI and a neutral RSI status, traders may want to adopt a cautious approach. Any decision should be backed by careful analysis of potential reversal indications and key price levels.
However, investors should consider entering on short positions, given the strong bearish indications, provided they adhere to strict risk management policies. It is also advisable to keep an eye out for breaches in the resistance level, as this may significantly affect the price movement.
Analysis of Time Frames
- 1-Week Time Frame: The overarching trend remains downward, with lower highs confirmed across several weeks.
- 1-Day Time Frame: A series of bullish candles have led to uncertainty; yet the potential for reversal exists.
- 4-Hour Time Frame: Momentum indicators point to potential short-term sell opportunities, despite recent bullish retracements.
Considering the analysis from these time frames, potential entry points in the 1-hour time frame could be identified as follows:
- Buy Entry Point: 3305, Take Profit: 3330, Stop Loss: 3290.
- Sell Entry Point: 3295, Take Profit: 3270, Stop Loss: 3305.
Based on the above indicators and trends, a Sell scenario appears more likely at this moment. The bearish setup, alongside careful monitoring of key resistance levels, could lead to profitable trading opportunities.


