USD/JPY Solidifies Upward Trend Amid Market Indicators – 12/05/2025
Tháng 5 11, 2025Navigating Forex Trading Trends: Key Insights on Volumes and Currency Movements
Tháng 5 12, 2025Market Overview:
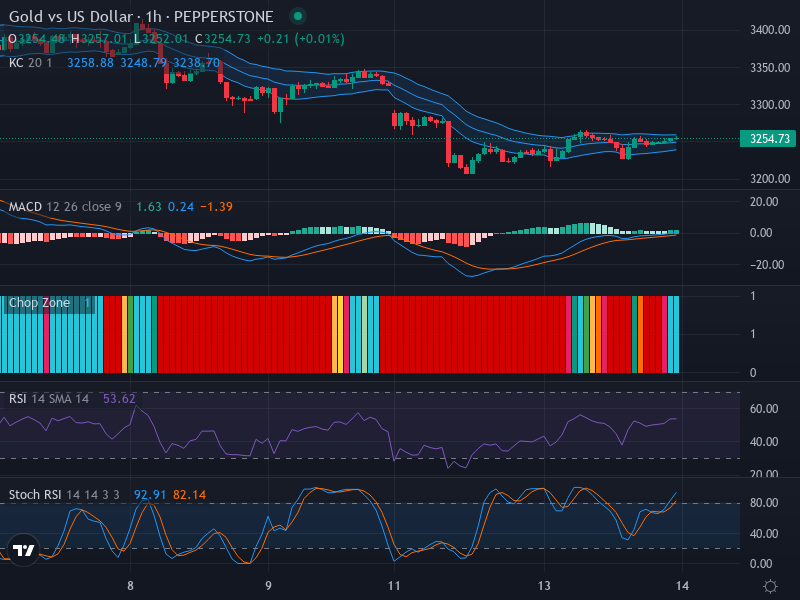
Gold, in recent times, has been caught in the throes of a downwards trend against the US Dollar. Riding on the momentum of prevailing bearish sentiment, the precious metal is expected to potentially continue its decline. Against an array of red candlesticks, gold’s struggle to shine bright is clear. Nevertheless, the market’s proximity to oversold conditions hints at the possibility of an imminent short-term bounce.
Technical Analysis:
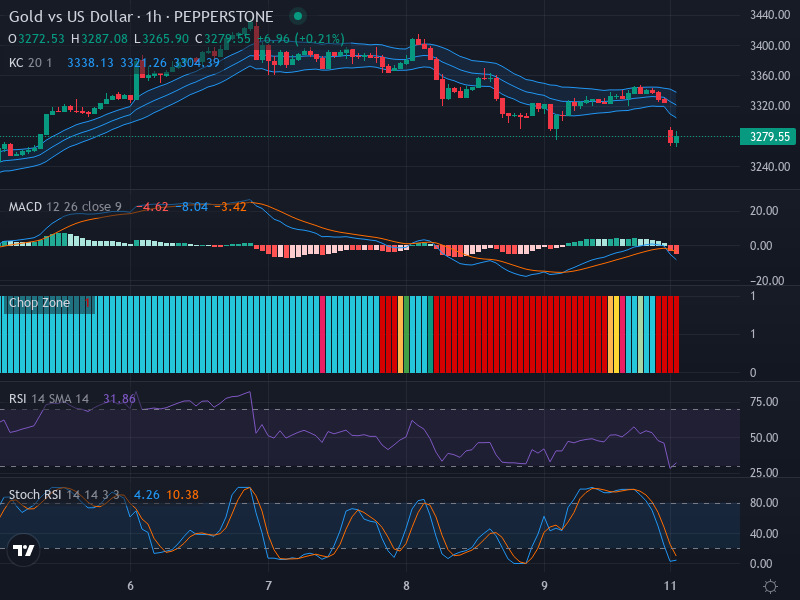
Unraveling the price patterns, the bearish trend is marked by successive red candlesticks. The fervent sell-off in gold is pushing the prices towards a critical retracement zone near the 3300 level—a level previously providing support, now turned into a formidable resistance.
The Relative Strength Index (RSI), a momentum oscillator, recorded the market nearing the oversold territory with a current reading of 31.86. This could suggest an impending change in course, or at least a temporary pause in the price drop. However, the absence of clear RSI divergence essentially validates the ongoing bearish sentiment.
On the Stochastic RSI front, the K line currently sitting below the D line reflects an amplifying bearish momentum. However, the oscillator also suggests that prices are nearing oversold levels, which might lead traders to reconsider their selling pressure—a possible dampening of the bearish tide.
The currency pair’s price is navigating below the middle band of the Keltner channel (EMA 20), affirming the bearish trend. Nevertheless, the widening channel width tells a tale of escalating volatility. A final glance at the chop zone reveals domination by blue bars, suggesting less likelihood for a choppy market and more for a directional one.
The Moving Average Convergence Divergence (MACD) analysis does nothing to dispel the bearish overtones. The MACD line treads below the signal line—in line with our bearish narrative. The growing MACD histogram further deepens the bearish echoes, lodged as it is in the negative zone.
Conclusion and Trading Recommendations:
In light of the technical analysis, the bearish trend in gold practically leaps off the charts. Nonetheless, the potential for a short-term reversal cannot be brushed aside considering the market’s proximity to oversold regions.
Traders should analyze multiple time frames for deeper insights. Looking at the 1-week, 1-day, and 4-hour time frames delivers the following points:
- The 1-week trend indicates continued bearish momentum with no immediate signs of reversal, reinforcing the downtrend.
- The 1-day chart is leaning towards oversold conditions but does not yet support a clear bullish signal, remaining in the bearish zone.
- The 4-hour chart shows increasing sell pressure, confirming a bearish bias in the short term.
From these analyses, potential entry points can be identified at the 1-hour time frame based on the indicators:
- Buy entry point could be set at 3290, with a Take profit point at 3315 and a Stop loss point at 3280.
- Sell entry point could be established at 3285, with a Take profit point at 3265 and a Stop loss point at 3295.
Given the prevailing bearish trend and the steady indicators supporting this analysis, a Sell scenario appears more likely in the near term, especially as the market is still influenced by strong downward momentum.