
Mixed Signals in the USD/CAD Forex Market – A Blend of Bullish and Bearish Indications – 09/04/2025
Tháng 4 8, 2025
Evaluating the Bearish Momentum in USD/JPY Forex Pair: Potential for Retracement Ahead – 09/04/2025
Tháng 4 8, 2025Market Overview:
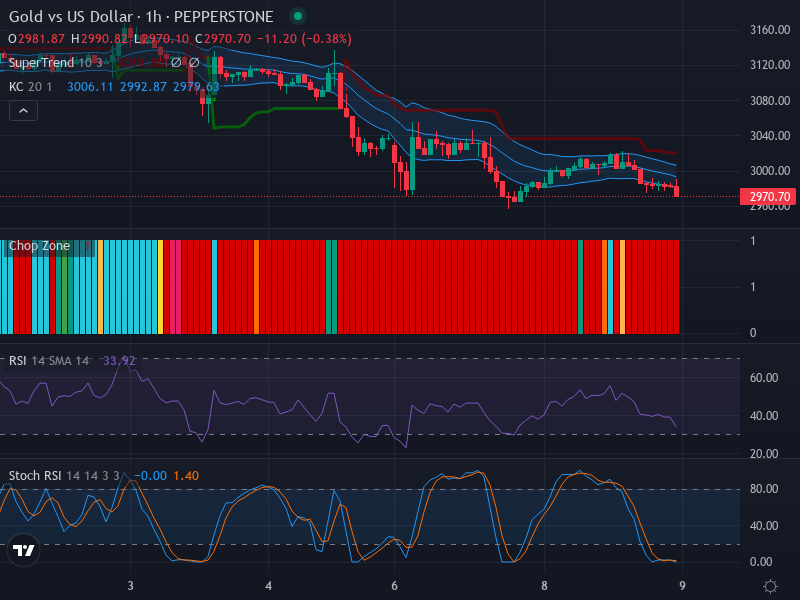
The forex market for the Gold vs US Dollar pair seems to be under a strong bearish grasp currently due to amplified selling pressures. Despite the oversold conditions indicated by the Relative Strength Index (RSI), the market remains decidedly bearish in both short and medium-term trends, painting a rather peculiar picture for this pair.
Technical Analysis:
Starting with the candlestick pattern interpretation, it’s crucial to note the unbroken sequence of bearish candles implying prevalent selling pressures. Interestingly enough, there is a significant absence of notable reversal formations like bullish engulfing or doji candles, a clear indication that the downtrend is sturdy.
A closer inspection of potential retracement areas reveals that the 3000 level may offer minor support, as it did previously. It’s worth exploring this level for hints of stabilization or a possible trend reversal.
The standard RSI reading sits at 33.92, signifying an oversold scenario. This points to a possible rebalancing of this market with diminished selling pressures and an upcoming price pullback; yet, such conditions still support the observed downward trend. A conspicuous lack of divergence emphasizes that both the 1-week and 1-day trends remain bearish.
Further investigation using the Stochastic RSI provides some fascinating insights. A Stoch RSI K level of -0.00 and a D level of 1.40, with the K line below the D line, solidify the current bearish momentum. Nevertheless, an imminent crossover could indicate a potential reversal if prices display stability.
Lastly, studying the Keltner Channels and Chop Zone unveils additional solid predictive indicators. The price remains well below the middle band of the Keltner Channels, insinuating continued bearish tendencies. The expansion of these channels suggests a heightened level of Forex market volatility.
Equally important, the Chop Zone looks predominantly red, further confirming a sustained, substantial downward trend with minimal sideways movement.
Conclusion and Trading Recommendations:
Considering a persistent downward trend across multiple time frames (1-week, 1-day, and 4-hours), the current technical analysis overwhelmingly supports selling Gold against the US Dollars. However, given the oversold conditions and potential pullback within a foreseeable future, traders might want to keep a tight stop-loss and stay alert for unexpected bullish reversals.
In summary, analyzing the recent trends yields the following insights: the 1-week time frame remains firmly bearish with consistent selling pressure; the 1-day analysis illustrates ongoing bearish momentum with limited retracement; the 4-hour charts indicate similar bearish conditions while still hinting at potential pullback opportunities. These perspectives suggest systematic selling strategies.
Potential entry points based on this thorough analysis include: Buy entry point at 3010, Take profit point at 3030, Stop loss point at 3000. Sell entry point at 2990, Take profit point at 2970, Stop loss point at 3000. The analysis leans more towards a Sell scenario given the prevailing bearish trends and supportive indicators, yet traders should remain vigilant for any rapid bullish reversals.
Risk Disclaimer:
The above analysis and subsequent trading recommendations contain certain elements of risk, subject to changes due to unpredictable market dynamics, including shifts in economic conditions, monetary policy alterations, sudden technical factors, and political events. Traders should perform personal research and careful financial decision-making. This analysis does not constitute professional trading advice, and individuals should trade based on their risk tolerance and financial capacity.


