
Navigating the Currents: Technical Analysis of USD/CAD Forex Market – 30/04/2025
Tháng 4 29, 2025
Sideways Movement Dominates USD/JPY: A Close Inspection of Recent Market Behavior – 30/04/2025
Tháng 4 29, 2025Market Overview:
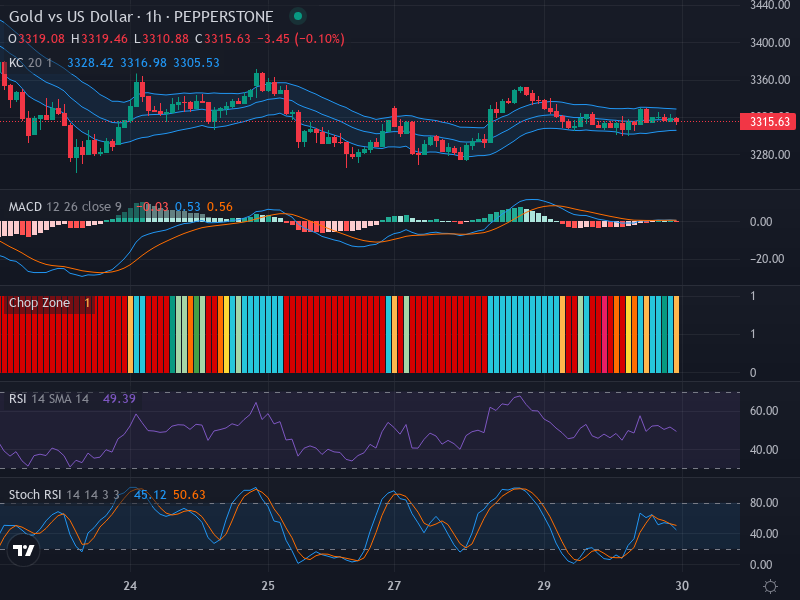
As we delve into the intricate examination of the Gold versus US Dollar currency pair, the current market temperature shows arrows pointing towards a rather calm, lateral landscape. At the present rate of 3315.63, the market characterises few fluctuations, with neither solid bullish nor bearish dominance ruling the roost. Market movement, at this stage, appears to be walking on a tightrope of neutrality, leaning slightly towards a minor bearish trend.
Technical Analysis:
The candlestick pattern that has currently formed in the despairing exchange between Gold and USD underscores significant neutrality, demonstrating small bodies indicative of a muted market play. No notable bullish or bearish imprints such as a hammer or engulfing candle are spotted, further solidifying the ongoing neutrality. Following these patterns, traders should keep an eye out for a possible slide towards the support point of 3305.53, especially amid any increment in short-term bearishness.
Elaborating further into the technical indications with the aid of the Relative Strength Index (RSI), the emerging picture seems cohesive with our primary analysis. Standing firm at 49.39, the RSI remains parked in the neutral zone, steering clear of overbought and oversold territories. The midline hovering specification suggests an undercurrent of a lateral trend, providing no distinct divergences in reference to the price movement.
The set of Stochastic RSI data puts a feather in the cap with conformity to the prevailing muted scenario. With K Line resting at 45.12 and D Line at 50.63, the crossover paints a slight bearish portrait hinting towards a mild downward momentum. This trend appears to favour a potential extension of bearish or lateral vagueness in the market oscillations.
In alliance with the trend assessed by Stoch RSI, the analysis of MACD supports the narrative. The subtle disparity between the MACD Line (0.53) and Signal Line (0.56) puts forth a delicate bearish overtone in the market. Additionally, the histogram mirrors this muted bearishness, well-aligned with the direction of the other indicators.
Conclusion and Trading Recommendations:
Given the current technical landscape, the Gold to USD pair is enveloped in a lateral manoeuvre leaning somewhat towards a minor bearish trend. Considering the lack of strong bearish or bullish hints, it is recommended for traders to assume a cautious stance, staying ready for any shift closer to the support level of 3305.53.
Market Trends Analysis:
- 1-Week Time Frame: The overall trend remains neutral with slight bearish tendencies indicated through recent closing prices hovering near support levels.
- 1-Day Time Frame: Price action is sideways, with rare spikes hinting at a continuation of the current range without a strong commitment to either side.
- 4-Hour Time Frame: Continued small retracements show indecision; however, bearish moves seem slightly more favored based on momentum indicators.
Potential Entry Points:
- Buy Entry Point: 3320.00, Take Profit Point: 3340.00, Stop Loss Point: 3300.00.
- Sell Entry Point: 3305.00, Take Profit Point: 3285.00, Stop Loss Point: 3315.00.
Based on the analysis of the indicators and trends, it appears that a Sell scenario is more likely given the subtle bearish undertones and proximity to significant support levels.


