
Michigan Consumer Sentiment Index: May 2025 Highlights
Tháng 5 16, 2025
Alibaba’s AI Revolution: Shaping E-Commerce and Advertising Trends in 2025
Tháng 5 16, 2025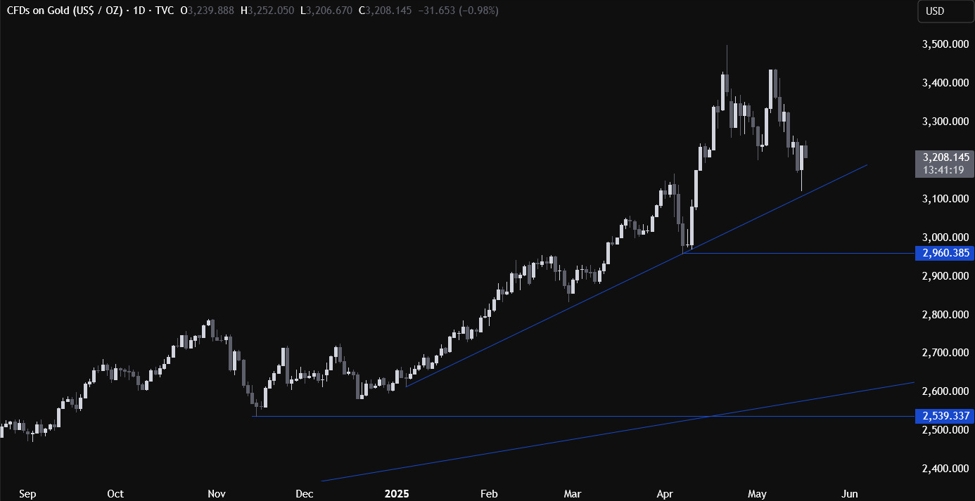
In-Depth Analysis of Recent Gold Price Movements: A Bearish Outlook
Current Price Movement
In the ever-fluctuating world of commodities, gold has recently captured the attention of traders and investors alike as its prices have entered a notable decline. Currently, gold is priced below $3,260, revealing a bearish short-term trend. This decline is significantly underpinned by the price’s position relative to the Exponential Moving Average (EMA50), which indicates a phase of short-lived strength among bulls. The sustained positioning beneath the EMA50 illustrates a lack of bullish momentum, reinforcing the overall negative sentiment in the market.
Understanding Technical Indicators
A closer examination of key technical indicators reveals crucial insights into the dynamics at play in the gold market. The Relative Strength Index (RSI) has recently displayed a negative divergence following an overbought condition. This suggests that sellers may have the upper hand, with potential for further price declines ahead. Meanwhile, the Moving Average Convergence Divergence (MACD) provides additional confirmation of bearish momentum, yet it is worth noting that the RSI has not yet entered the oversold territory. This could imply that while the selling pressure is present, more room for downward movement exists before the market may find any significant support.
Support and Resistance Levels
To navigate the choppy waters of gold trading, understanding support and resistance levels becomes vital. Presently, significant support levels appear to cluster around $3,200, $3,160, and $3,120. On the flip side, resistance levels can be observed at $3,270, $3,330, and $3,380. The recent price stabilization around $3,235 reflects persistent bearish pressure. If the prices continue to hover around this area, it may signify an impending test of the support levels. A decisive breach could lead to accelerated selling and further erosion of prices.
Market Conditions Impacting Gold Prices
A notable factor influencing the decline in gold demand stems from easing global trade tensions. Positive trading negotiations, particularly between the U.S. and China, have decreased the appeal for safe-haven assets like gold. As stability returns to the broader market, investors are likely reallocating their portfolios away from traditionally defensive investments such as gold, further weighing down its price. This situation is further contextualized by strategic moves made by China, which can influence market dynamics and investor behavior. For a deeper dive, consider exploring how easing U.S.-China trade tensions correlate with market dynamics in this blog: Three Strategic Moves by China Xi.
Forecasting Future Trends
Looking ahead, the forecast for gold remains predominantly bearish. Analysts predict continued price declines if the commodity settles below critical support levels. The expected trading range appears to be confined between $3,180 and $3,260, and vigilance will be essential for traders as the situation unfolds. For those interested in understanding investment strategies that could potentially mitigate losses during such downturns, the blog on top investment mistakes to avoid in 2023 provides valuable insights.
In conclusion, the recent technical analysis of gold underlines the current bearish sentiment that reigns in the market. Traders should remain cautious and observe market developments closely, especially in light of external economic factors that significantly influence gold prices. With necessary support levels in place, the potential for further declines remains a key focus for all involved in gold trading. Insights from value investing strategies can also be found in this discussion on Greenblatt’s value investing, which may offer guidance on long-term strategies amidst market volatility.