

David Hogg’s Rising Star or Party Division? Inside the DNC’s Turbulent Landscape
Tháng 5 14, 2025Michigan Consumer Sentiment: January 2025 Analysis and Insights
Tháng 5 14, 2025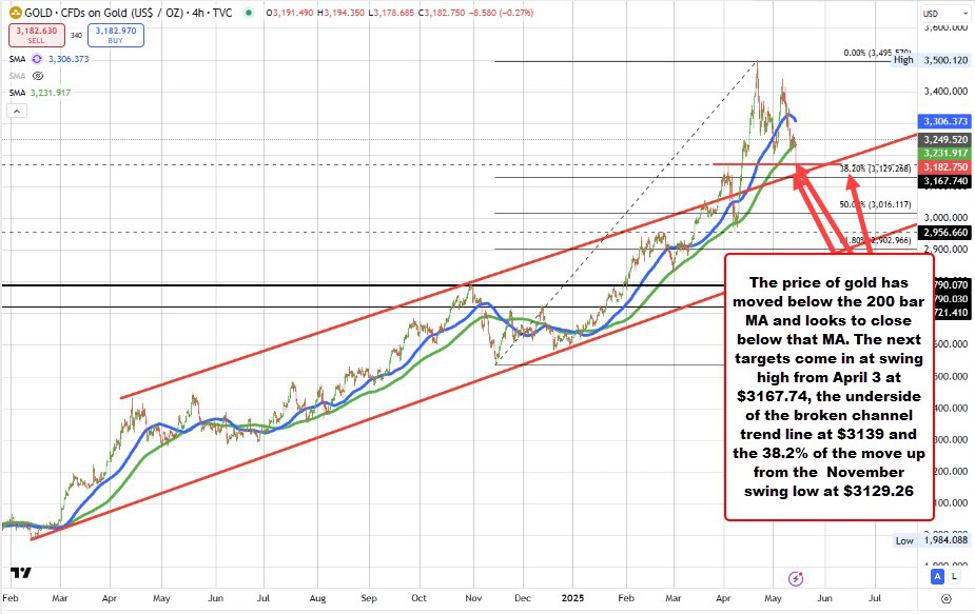
Gold Price Analysis: Navigating Recent Technical Shifts and Market Sentiment
In recent weeks, the gold market has experienced notable fluctuations, primarily driven by a significant shift in momentum. Recent technical analysis reveals that gold has diverged from its stable patterns, breaking below crucial support levels, most notably the 200-bar Moving Average (MA) on the 4-hour chart. This breach signals a transformation in market dynamics that traders and investors should closely monitor.
Key Technical Insights into Gold’s Price Movements
The recent fall of gold prices below the $3258 mark on the 4-hour chart is a key indicator of bearish momentum. Initially, it tested this support level, but after a retest, it continued to decline, indicating heightened selling pressure. Analysts suggest that if gold breaks through its recent lows, the next significant price target could be around $2957. Conversely, for gold to show signs of recovery and initiate a rally, it must rise above the $3258 threshold, where potential target levels could range around $3367. This duality in resistance and support emphasizes the critical nature of these levels in guiding trading strategies.
Understanding Market Sentiment and Its Impact on Gold
The decline in gold prices can be attributed to changing market sentiment associated with a rising risk appetite and a strengthening U.S. dollar. Investors are increasingly attracted to riskier assets amid positive global growth forecasts, which has put downward pressure on gold prices. Despite this recent decline, it’s essential to note that gold continues to maintain an overarching uptrend. This is largely predicated on the expectation that real yields will fall, particularly as the Federal Reserve indicates a path of easing—creating an environment that typically favors gold as a hedge against inflation. For insights into avoiding common pitfalls in the current investment climate, you can explore more about key investment mistakes to avoid for 2023.
Identifying Support and Resistance Levels
For traders looking to navigate these turbulent waters, understanding the critical support and resistance levels is paramount. Buy signals are projected to emerge around the $3165 mark, presenting potential opportunities for entry as market volatility unfolds. On the resistance side, the range between $3300 and $3370 could prove pivotal for any upside movements. This zone represents a battleground between buyers seeking to reclaim lost ground and sellers capitalizing on the bearish momentum.
Conclusion: What Lies Ahead for Gold Prices
Gold’s recent technical analysis depicts a market in transition, one where bullish and bearish forces are in active conflict. As traders assess the implications of technical breakdowns and market sentiment, the importance of remaining vigilant around key price levels cannot be overstated. Striking a balance between caution and opportunity is essential as the landscape evolves, potentially presenting both challenges and avenues for profit in the precious metals market. Additionally, to enhance decision-making in such a volatile environment, it’s vital to learn from psychological missteps that can lead to irrational trading decisions. Keep an eye on the unfolding trends as they could shape the future trajectory of gold prices in the upcoming weeks.