
USD/JPY Marches Sideways: Intermittent Bullish Signals Require Scrutiny – 01/05/2025
Tháng 4 30, 2025South Korea’s Export Surge: Resilience Amid U.S. Tariff Challenges
Tháng 5 1, 2025Market Overview:
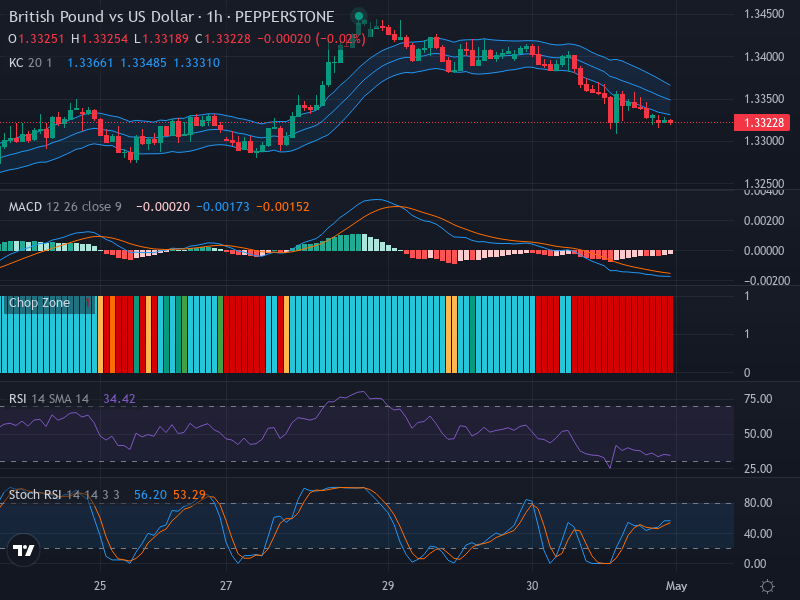
In the foreign exchange market, the sterling pound is currently underperforming against the US dollar, illustrated by a price of 1.33228. The prevailing bearish momentum, as represented by a series of consequent bearish candlesticks, suggests a dominant downward trend. This unfavorable stance for the pound is not showing immediate signs of reversal, providing an intriguing context for further technical analysis.
Technical Analysis:
Firstly, the observation of candlestick patterns indicates a robust downward trend—unimpeded by significant bullish reversal cues such as bullish engulfing or hammer patterns. Moreover, a potential resistance to price decline exists around the 1.3300 mark. This serves to underline the presence of a strong bear bias in the pair’s price action.
Turning to the Relative Strength Index (RSI), the current value stands at a near-oversold 34.42. Thus, despite the existing low price, there might still be room for a further slight decline before a potential trend reversal.
Coinciding with this, the Stochastic RSI demonstrates a slight bullish divergence, but not to a degree robust enough to suggest an impending reversal. The K and D lines (56.20 and 53.29 respectively) hint at short-term price bounce opportunities.
In the realm of the Moving Average Convergence Divergence (MACD), the chart highlights a recent bearish crossover, with a MACD line at -0.00173 and a Signal line at -0.00152. Consequently, a negative histogram manifests, indicating that the bearish momentum is indeed slowing down. This flattening could be a precursor to a period of heightened volatility.
Lastly, complementing the above insights, the Keltner Channels and Chop Zone indicators reinforce the bearish narrative. With the GBP/USD price lingering below the Keltner Channels’ middle line and the Chop Zone affirming a bearish routine, the market is clearly biased towards the bears.
Conclusion and Trading Recommendations:
The technical analysis across multiple indicators corroborates the GBP/USD pair’s ongoing bearish bias. Potential for further downward movement exists, albeit with weakening momentum. However, traders should beware as the near-oversold RSI and the flattening MACD histogram suggest an approaching swing in volatility, which may result in a retracement.
Analyzing the 1-week, 1-day, and 4-hour time frames reveals the following trends:
- 1-Week Trend: Continues to emphasize bearish pressure; fewer buy signals appear as selling momentum remains strong.
- 1-Day Trend: Confirms a minor consolidation period; however, a strong resistance at 1.3350 limits upward movement.
- 4-Hour Trend: Shows a potential for minor retracement; traders should look for confirmation before entering a buy position.
Based on this analysis, potential entry points are as follows:
- Buy Entry Point: 1.3300, Take Profit Point: 1.3350, Stop Loss Point: 1.3280
- Sell Entry Point: 1.3310, Take Profit Point: 1.3250, Stop Loss Point: 1.3330
Given the overarching bearish sentiment across the examined time frames, a Sell scenario appears more likely in the near term. Traders should continue monitoring the market closely for any potential changes in momentum.


