
Gold vs US Dollar: Analysis Indicating Bearish Momentum Amid Sideways Market Conditions – 26/05/2025
Tháng 5 25, 2025EURUSD Sideways Strategy: Comprehensive Market Prediction
Tháng 5 25, 2025Market Overview
The FX pair GBP/USD is presently favored by buyers, showcasing an uptrend. The pair is currently trading at 1.35361. However, despite the market’s upward direction, there is a lack of any remarkable bullish pattern like a hammer or bullish engulfing on lower hour candlestick charts. Traders can expect resistance or even potential reversal as the price nears the crucial 1.35400 level, which is in line with the upper Keltner Channel.
Technical Analysis
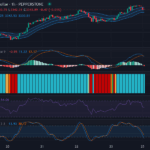
The bullish run holds steady in the case of the British Pound against the US Dollar, but dynamic resistance levels around 1.35400 present some concern. The Keltner Channels, which often act as dynamic support and resistance, support this observation, with the price currently riding above the middle Keltner band, indicating a strong upward momentum.
In terms of momentum oscillators, the Relative Strength Index (RSI) is currently standing at 68.31, nearing the overbought territory. Although RSI supports an ongoing uptrend, the absence of a significant divergence suggests this uptrend may be running out of steam.
This pattern is echoed in the Stochastic RSI. The K line at 46.70 and the D line at 51.99 fail to exhibit any significant crossover. While there is a slight hint of deceleration, suggesting the existing upward momentum may experience resistance, the relative position of these two lines does not predict a clear market move yet.
Furthermore, the Moving Average Convergence Divergence (MACD) analysis supports a bullish outlook by virtue of the MACD line being above the signal line. However, the slightly downward histogram trend suggests the upward momentum might be weakening.

Conclusion and Trading Recommendations
Whilst the overall picture for the GBP/USD points towards bullishness, signs of weakening momentum and the nearing key resistance level should call for investor caution. Currently, the market will likely hover around the 1.35400 region, providing traders the opportunity to scrutinize this resistance level further before entering any long-term positions.
At this stage, should the GBP/USD pair convincingly cross the 1.35400 resistance level with supportive volume, traders might consider taking a long position, betting on the continuation of the bullish run. Alternatively, if the pair shows indications of price reversal at this resistance level, a short position may be the safer play.
1-Week, 1-Day, and 4-Hour Trend Analysis
Upon analyzing the 1-week, 1-day, and 4-hour time frames, three key observations emerge:
- The 1-week trend indicates a strong upward movement, supported by consistent bullish closes, yet caution is advised as the market approaches the resistance zone.
- The 1-day timeframe shows a slight weakening in momentum, particularly evident through daily candlestick patterns, suggesting a potential pause or reversal.
- The 4-hour charts reflect mixed signals; sideways movement alongside bullish attempts indicates a tug-of-war between buyers and sellers around the 1.35400 mark.
From these analyses, potential entry points based on the indicators include a Buy entry point at 1.35550, with a Take profit at 1.35800 and a Stop loss at 1.35300. Conversely, a Sell entry point could be at 1.35200, with a Take profit at 1.35000 and a Stop loss at 1.35350.
Considering the current market conditions and momentum indicators, a Buy scenario appears more likely, especially if the GBP/USD convincingly breaks the 1.35400 resistance level with adequate volume, supporting further upward movement.


