Bullish Reversal Signs Emerging in USD/CAD Amidst Predominantly Bearish Trend – 22/05/2025
Tháng 5 21, 2025
Loudoun County Locker Room Controversy: A Deep Dive into Transgender Rights and School Policy Debates
Tháng 5 22, 2025Market Overview
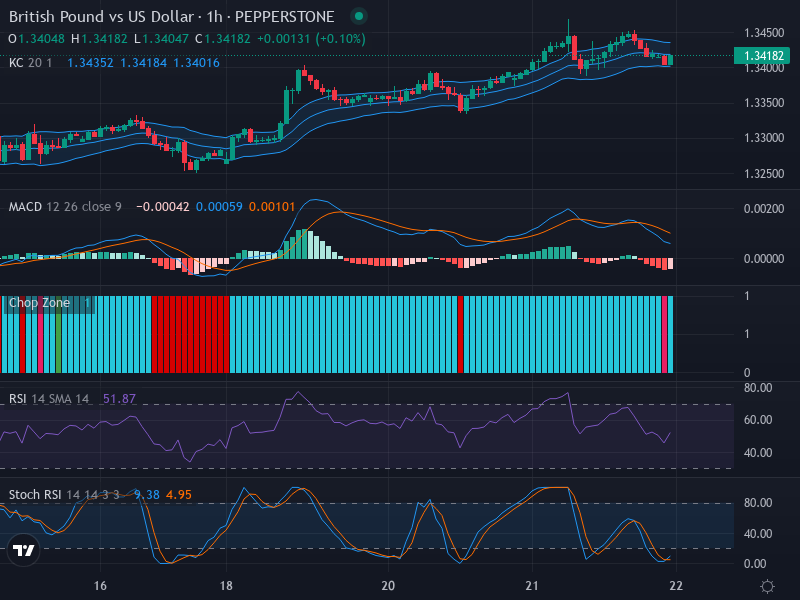
The GBP/USD pair continues to gain momentum after a recent completion of a bullish pattern signifying an upward trend. Currently trading at the price level of 1.34182, the pair’s price trajectory paints a cautiously optimistic outlook. The pair’s resilience amidst the Forex market’s usual volatility signals a potential extension of the bullish run.
Technical Analysis
In terms of chart patterns, the GBP/USD pair is seen to exhibit a bullish trend, characterized by higher highs and higher lows. Furthermore, a close examination of candlestick patterns does not denote any immediate sign of reversals such as the doji, bearish engulfing, or hanging man scenario. This symptom indicates a fair degree of trend continuance.
An in-depth examination of the Relative Strength Index (RSI) complements the earlier assessment of the market direction. Currently standing at 51.87, the RSI is in the neutral zone, not indicating overbought or oversold conditions. The trend support is sound, with no apparent divergence.
Expanding upon the Keltner Channels and Chop Zone analysis, price movement within the Keltner Channels reflects the GBP/USD pair’s moderately upward trend. An expansion of the channels indicates medium volatility, a somewhat tamed behavior compared to the often rampant fluctuations in the Forex scene. The chop zone, depicted through blue bars, shows a lack of strong directional movement, which could indicate a sideways accumulation.
Stochastic RSI scrutiny is a must for excellent technical analysis. Keep an eye on the K and D lines’ values. Any abrupt shifts here can caution traders about potential volatility and trend shifts.
Conclusion and Trading Recommendations
The current technical landscape suggests that the GBP/USD pair has the potential for a bullish continuation. Based strictly on the analysis performed, traders might consider taking a long position. However, it is crucial to maintain caution due to the inherently unpredictable nature of Forex markets.
Based on the analysis across various time frames:
- 1-Week Time Frame: The market shows a strong upward trend, supported by robust buying volumes.
- 1-Day Time Frame: The recent price action confirms the bullish sentiment, further solidifying support around the current level.
- 4-Hour Time Frame: The chart illustrates consistent bullish patterns without any immediate signs of reversal.
From this analysis, potential entry points based on the 1-hour time frame are as follows:
- Buy Entry Point: 1.34400, Take Profit Point: 1.34850, Stop Loss Point: 1.34000.
- Sell Entry Point: 1.33900, Take Profit Point: 1.33450, Stop Loss Point: 1.34150.
Given the overall bullish sentiment in the market, a Buy scenario is more likely to occur, making it favorable for long positions.