

Transforming Accountability: The Overhaul of Federal Performance Reviews
Tháng 5 2, 2025Navigating Tensions: Beijing’s Fentanyl Proposal and Its Impact on U.S.-China Relations
Tháng 5 2, 2025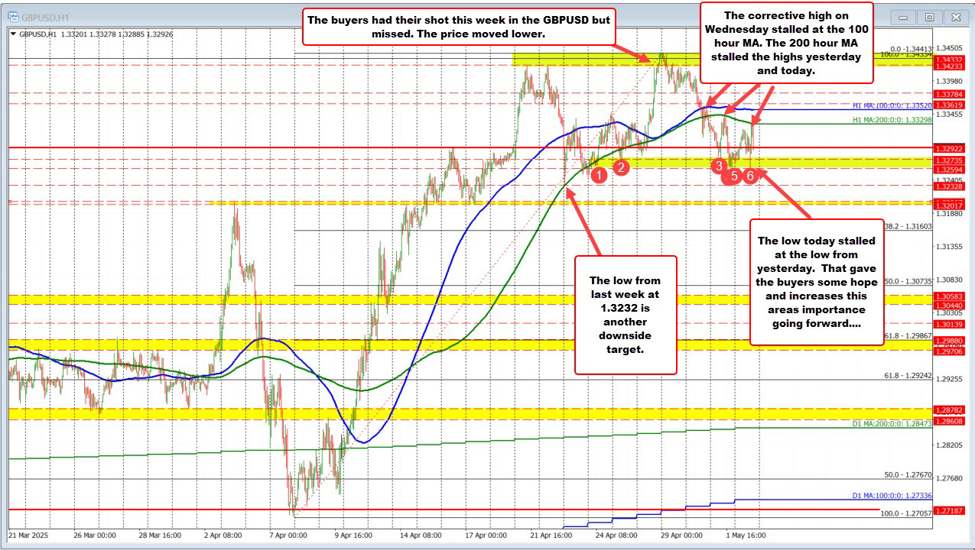
GBP/USD Technical Developments: An Analysis of Recent Trends and Patterns
The GBP/USD currency pair has recently experienced notable technical developments that have captured the attention of traders and analysts alike. As of April 30, the pair has shown persistent pressure below significant moving averages, indicating a potential bearish trend. A closer examination of these technical indicators reveals crucial insights into the currency pair’s performance and points to a challenging environment for bullish sentiment. For more insights on current trends in GBP/USD, see this article on key technical notes.
Failed Breakout Leads to Bearish Momentum
On April 30, GBP/USD attempted a rally, reaching a peak of 1.34413, the highest level since February 2022. However, this upside movement was unable to maintain momentum, resulting in a sharp reversal. This failure to sustain above the key resistance level of 1.3433, identified as the 2024 high, raises concerns about the strength of bullish momentum in the market. The abrupt decline following the peak illustrates the fragility of buyer support and underscores the market’s current bearish sentiment.
Analysis of Moving Averages and Support Levels
The technical structure as of the end of April remains bearish, with the GBP/USD price trading below both the 100-hour moving average (MA) at 1.33547 and the 200-hour MA at 1.33405. These moving averages serve as critical benchmarks that traders watch closely. The inability to break above these averages suggests a lack of bullish conviction and indicates that sellers currently dominate the market.
Key support levels are identified at 1.3292, corresponding to the swing high from April 16, and 1.32328, which marked last week’s low. These levels could act as crucial barriers against further downward movement, but if breached, the outlook for GBP/USD may worsen significantly. Traders should keep a close eye on these support levels as potential indicators of future price action.
Seasonal Trends to Consider: May’s Historical Performance
Adding another layer of complexity, historical data for the month of May reveals that GBP/USD typically averages returns of -0.37%. This seasonal trend aligns with the current technical rejection observed at the critical moving averages. Such data suggests that May may not be the most favorable month for bullish positions in GBP/USD, and traders should factor this into their strategies moving forward. For a broader perspective on USD/CAD trends, look at the analysis on short-term market outlook.
The upcoming analysis on May 2 could provide further updates to this technical setup, but the data available through April 30 clearly indicates that sellers maintain a strong grip below the pivotal 100-hour moving average. As the market evolves, traders must remain vigilant to navigate the challenges posed by both technical indicators and seasonal trends that could impact their positions within this currency pair.
In conclusion, the recent developments in GBP/USD warrant cautious monitoring, particularly as a confluence of failed breakouts, bearish momentum below key moving averages, and historical May performance converge. Market participants must stay attuned to these technical signals to inform their trading strategies effectively in this dynamic currency landscape.