Forex Technical Analysis – May 21, 2025 – 21/05/2025
Tháng 5 20, 2025
EUR/USD Exhibits Bullish Momentum: Technical Insights & Trade Suggestions – 21/05/2025
Tháng 5 20, 2025Market Overview
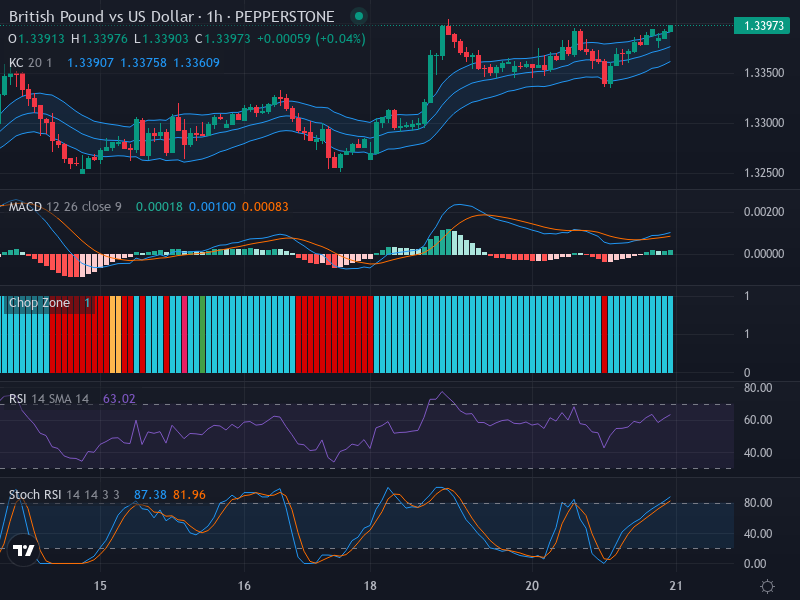
Presently, the British Pound (GBP) is showing a promising bullish trend against the US Dollar (USD), trading around 1.33973. This comes on the back of consistent upward candlestick formations with no significant reversal patterns, thus, indicating the potential for continued upward movement on the forex chart.
Technical Analysis
Amidst the rise, critical focus is on the resistance zone around the 1.3400 level, largely due to its psychological importance. A break and sustain above this level could potentially see the currency pair march towards higher levels.
The Relative Strength Index (RSI), presently at 63.02, echoes the bullish sentiment, still within neutral territory and not yet in the overbought arena. There is no divergence on the RSI, further reinforcing the ongoing upward trend in prices.
The Stochastic RSI tells a slightly different tale, with both K (current asset price in relation to a range over a set time period) and D (3-day simple moving average of K value) lines standing at 87.38 and 81.96 respectively, indicating an overbought territory. Moreover, the bearish crossover visible between the K and D lines suggests a potential short-term pullback, adding balance to the overall bullish sentiment.
In terms of Keltner Channels, a set of volatility-based envelope channels, the price is consolidating above the middle band, reinforcing the strength of the long-term bullish trend. The Chop Zone demonstrates short and continuous coloured bars, suggesting a strong trending market with minimal sideways movement.
The Moving Average Convergence Divergence (MACD) line (0.00018) crossing above the signal line (0.00010) further manifests a bullish crossover, which is an indicator of a potential upswing in the market.
Conclusion and Trading Recommendations
Amidst the present bullish trend, traders should keep an eye on potential resistance at 1.3400. A break above this level could provide an excellent opportunity to go long on the GBP/USD currency pair. However, the overbought Stochastic RSI signals possible short-term pullbacks, so investors must remain cautious.
As a rule of thumb, it’s advisable to have a well-calculated stop-loss to guard your investments against unexpected market turns. Given the present situation, a sensible stop-loss level might be below the middle Keltner Channel.
Trend Analysis by Time Frame
- 1-Week Time Frame: The trend remains bullish with consistent higher highs. The support level is strong, suggesting further upside potential.
- 1-Day Time Frame: A clear upward trend with recent price actions reflecting strength. The bullish crossover signals continued buying pressure.
- 4-Hour Time Frame: Short-term fluctuations show sporadic pullbacks, yet the overall momentum remains largely positive with buyers stepping in.
Potential Entry Points and Profit Zones
For trading on a 1-hour time frame:
- Buy Entry Point: 1.3420, Take Profit Point: 1.3450, Stop Loss Point: 1.3385.
- Sell Entry Point: 1.3380, Take Profit Point: 1.3350, Stop Loss Point: 1.3400.
In conclusion, given the strong bullish trend and considering the analysis above, a Buy scenario appears more likely, especially if the resistance at 1.3400 is convincingly broken.