
Impending Rallies on Gold Against the US Dollar: A Forex Market Analysis – 17/04/2025
Tháng 4 16, 2025Japan’s March Exports: Growth Amid Challenges in a Booming Economy
Tháng 4 16, 2025Market Overview
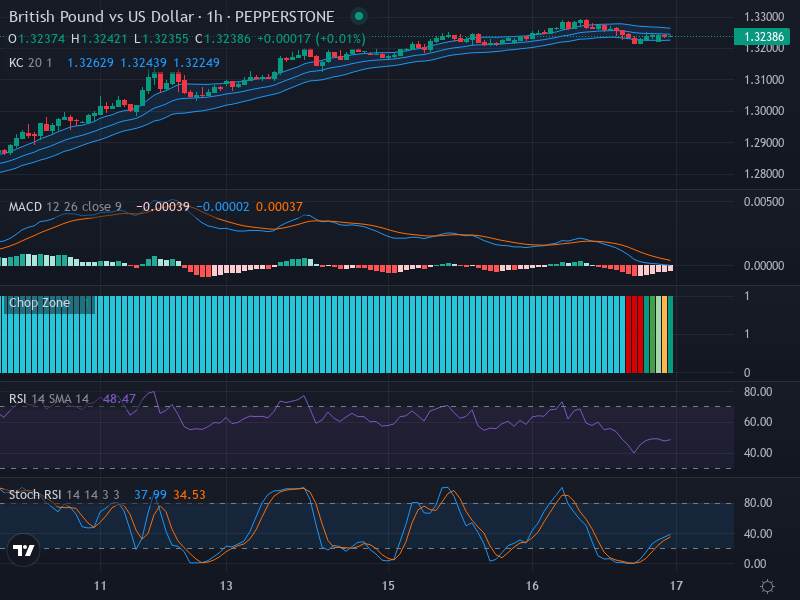
The Forex market scene for the British Pound (GBP) against the US Dollar (USD) is currently beaming with relative uncertainty. At the present price of 1.32386, the GBP/USD pair is showing a lack of clear direction, with no significant candlestick formations to suggest any decisive market movements. This current phase signifies a typical sideways market trend – a phase of indecision or consolidation known to precede significant price action swings.
Technical Analysis
Delving deeper into the pair’s specifics, it’s worth noting that the price presently hovers around the center of the Keltner Channel. This appears to validate the idea of a potential market accumulation phase or a period of directional ambiguity. Consistently, the Relative Strength Index (RSI) further supports this narrative, currently sitting at a neutral value of 48.47. This neutral RSI reading neither implies overbought nor oversold conditions, corroborating the existing lateral market movement. Furthermore, an extensive RSI examination revealed no significant divergences, underscoring the consistency in the current price movements.
Optimistically, however, the Stochastic RSI (Stoch RSI) presents a somewhat promising picture. The Stoch RSI’s K line (at 37.99) crossing over its D line (at 34.53) suggests a potential bullish momentum, albeit at subdued levels at this juncture. The proximity of the K and D lines further supports potential short-term upward momentum, an opportunity that short-term traders might consider exploiting.
Meanwhile, the Moving Average Convergence Divergence (MACD) presents a slightly different narrative. Currently, there is a bearish crossover with the MACD line below the signal line, indicating short-term bearish momentum. Nevertheless, the MACD histogram shows moderating bearish momentum and appears to be flattening, hence implying a potential weakening of the bearish momentum and a possible switch to bullish in the near future.
Conclusion and Trading Recommendations
In conclusion, the GBP/USD pair currently exhibits a sideways trend with potential short-term bullish momentum suggested by the Stoch RSI. Yet, the MACD indicates a subtle bearish undertone. Given this mixed outlook, traders could consider adopting a cautious strategy until a clearer market direction emerges. For short-term traders, they might consider potential buy opportunities when the short-term bullish momentum gets stronger, while more conservative traders might opt to wait for clearer bullish or bearish confirmations.
Short-Term Analysis
- 1-Week Time Frame: The analysis shows a mixed sentiment with potential consolidation. Given current patterns, price action may continue in this range before the market chooses a definitive direction.
- 1-Day Time Frame: Recent movements indicate indecision but are supported by potential bullish signals from indicators like Stoch RSI. Momentum may shift if buying pressure builds up, validating a short-term bullish stance.
- 4-Hour Time Frame: There is some evidence of price attempting to break out of the current range, suggesting a potential upward move. However, this remains contingent on sustained momentum from bullish signals.
Entry Points and Profit Zones
For those considering active trading strategies, the following entry points are observed:
- Buy Entry Point: 1.3250; Take Profit Point: 1.3300; Stop Loss Point: 1.3220. This setup allows traders to take advantage of expected upward movements while managing risk.
- Sell Entry Point: 1.3200; Take Profit Point: 1.3150; Stop Loss Point: 1.3230. This position can capitalize on brief downward retracements if bearish momentum intensifies.
In summary, based on the analysis and indicators, a Buy scenario seems more likely given the emerging bullish signals, particularly from the Stoch RSI, while keeping vigilant about potential shifts due to the mixed signals from the MACD.


