
Neutral Momentum Holds Sway Over the Euro vs US Dollar Pairing – A Detailed Technical Analysis – 06/05/2025
Tháng 5 5, 2025Westpac CEO Anthony Miller: A Beacon of Hope for Australia’s Economic Recovery
Tháng 5 6, 2025Market Overview
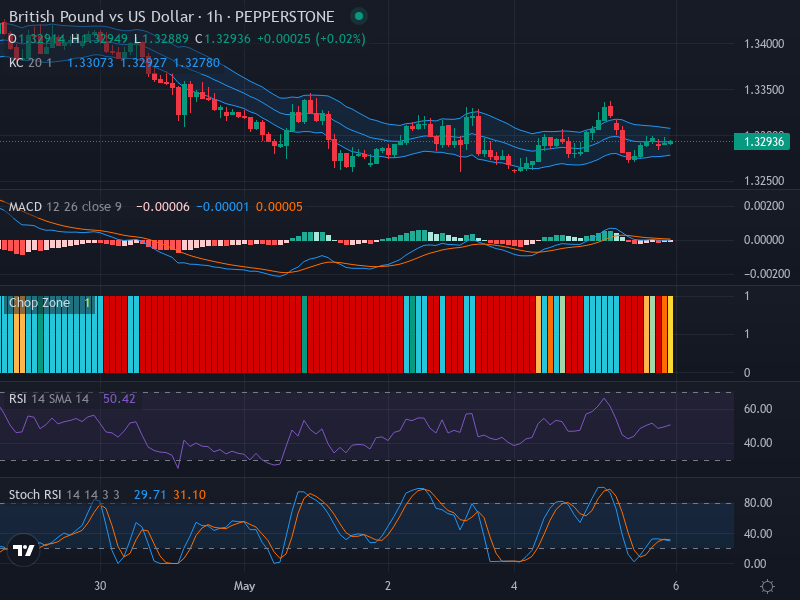
The GBP/USD currency pair is currently experiencing a state of flux at a price of 1.32936. The market, as evidenced by the preponderance of short-bodied candlesticks, reflects an undecided sentiment. Predictive indicators hint at potential price influx zones near 1.3350 (resistance) and 1.3250 (support). This narrative of indecision unfolds against a backdrop of neutral momentum, low volatility, and a sideways market trend.
Technical Analysis
The emerging patterns from candlestick interpretation suggest a predominance for a sideways market movement. This interpretation is reinforced by the tentative zones of potential resistance at 1.3350 and support around 1.3250.
The Relative Strength Index (RSI) is currently positioned at 50.42, corroborating the general sentiment of neutrality. This alignment with the identified sideways market warns against any expectations for strong momentum at present.
Additionally, the Stochastic RSI (K=29.71, D=31.10) indicates that the market is entering into oversold territory. This may serve as a precursor for slight bullish momentum, contingent upon a confirming cross of the K and D lines.
The analysis of Keltner Channels and the Chop Zone reinforces the narrative of a cautious trading period, with the price wavering between the middle and lower bands. The narrow confines of the channels further denote low present volatility, illustrating the wait-and-watch trend.
In terms of momentum, the Moving Average Convergence Divergence (MACD) analysis reveals a MACD Line at -0.00006 and a Signal Line at -0.00001. This equipment of perceived indecision is symbolized by a very slight bearish crossover, yet the minimal separation underscores an absence of a convincing trend. The MACD Histogram shows only slight rising bars, which testify to a lack of strong conviction among traders.
Conclusion and Trading Recommendations
Given the current market impasse and the dearth of strong trending indicators, traders should adopt a wait-and-see approach for the GBP/USD. While potential zones for price action exist at both the 1.3350 resistance and the 1.3250 support, the neutral RSI and the sideways chop zone suggest that any major price move is unlikely in the short term.
In conjunction with this analysis, let’s evaluate potential trading scenarios across multiple time frames:
- 1-Week Time Frame: The trend shows consolidative behavior, with resistance at 1.3350 not being convincingly breached and price hesitating around support at 1.3250. There’s overall indecision here.
- 1-Day Time Frame: Movement is volatile but remains within the range of 1.3250 to 1.3350, reiterating uncertainty. Each attempt at breakout has failed recently, signaling a delicate balance.
- 4-Hour Time Frame: Price oscillates close to the lower Keltner Band, reflecting selling momentum yet not enough to trigger stronger downward movement; stagnation is prevalent.
Considering this combined analysis, potential entry points and strategies can be outlined:
- Buy Entry Point: 1.3310, Take Profit Point: 1.3350, Stop Loss: 1.3280
- Sell Entry Point: 1.3270, Take Profit Point: 1.3250, Stop Loss: 1.3285
Considering the current conditions and analysis, a Buy scenario appears more favorable due to oversold conditions detected, though caution is warranted given the prevalent indecision in the market. Traders should remain flexible and responsive to changes in indicators, keeping risk management practices in place.


