Consolidation and Potential Breakouts: An Examination of Gold versus the US Dollar – 20/05/2025
Tháng 5 19, 2025
The Charge Against LaMonica McIver: Implications for Activism and Law in America
Tháng 5 20, 2025Market Overview
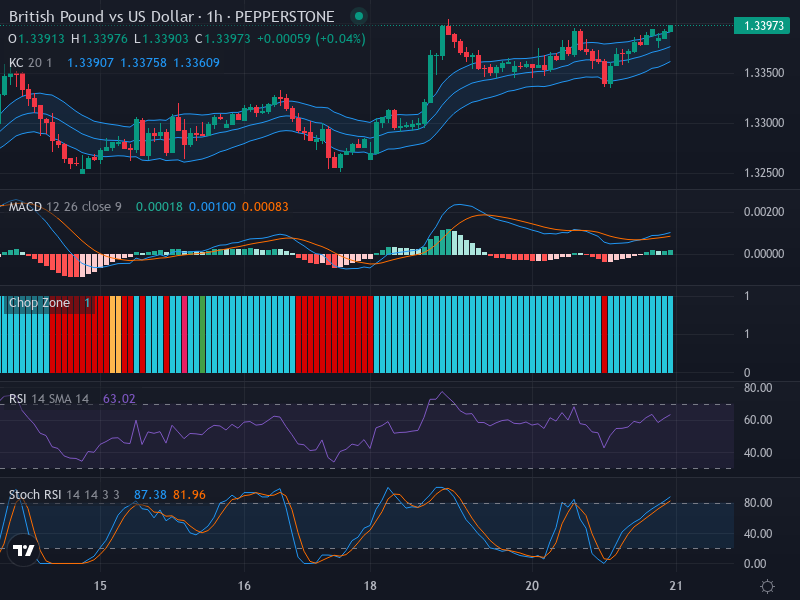
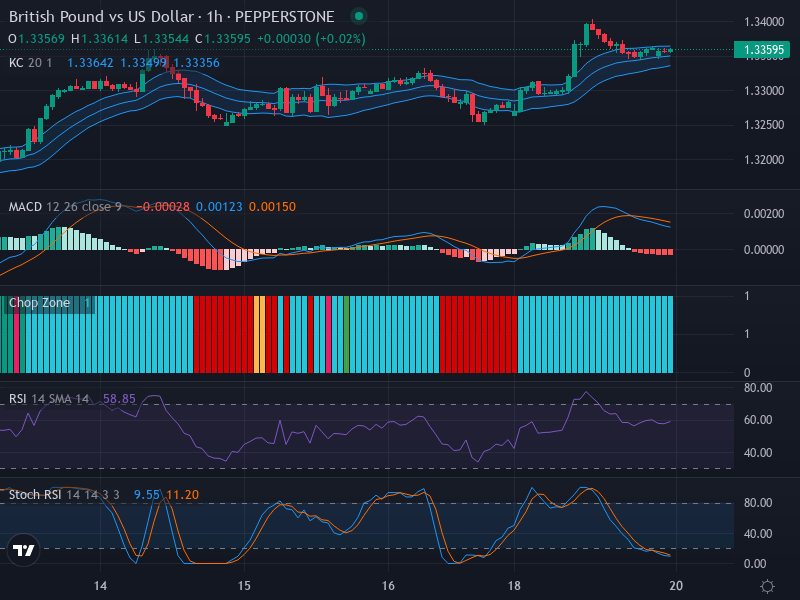
At the present moment, the GBP/USD currency pair trades at approximately 1.33595. Our analysis reveals signs of indecision in the market, manifested as small-bodied candle formations suggesting potential lateral movement, though with a slight upward bias. This indicates that traders are experiencing uncertainty, creating a state of flux with a slightly bullish-leaning trend.
Technical Analysis
Analyzing candlestick patterns in the context of the current picture, we can observe distinct signs of market direction. The market suggests lateral movement, albeit with a slight upward tendency. This wavering, coupled with specified bounds for potential shifts, indicates that a substantial price move could be expected soon. Should the price successfully breach above 1.33800, traders might anticipate an immediate ascension. Conversely, a fall below 1.33400 may lead to a marked retracement.
The Relative Strength Index (RSI) findings support the aforementioned lateral movement. With the current RSI value at 58.85, this positions it in the neutral zone, albeit leaning towards the overbought territory. Its alignment with price action showcases potential momentum shifts. The absence of notable divergence between the RSI and price activity suggests a relatively stable trend in the near term.
The Keltner Channels and Chop Zone further corroborate this narrative. As the price hovers near the upper band of the Keltner Channel, this indicates a potential latent bullish trend. The moderately expanded channels illustrate average market volatility. The predominance of bold blue bars in the Chop Zone highlights the current predominantly sideways market movement. Should the price close outside the Keltner Channel for two successive candles amidst a neutral Chop Zone, traders should be prepared for possible breakout opportunities.
The stochastic RSI highlights the K and D lines dwelling below 20, positioning it in oversold territory. This setup could herald a potential upward price movement as the environment grows conducive for buying.
Conclusion and Trading Recommendations
In conclusion, the GBP/USD market is technically locked in a phase of indecisiveness, teetering on a moderate bullish inclination. Traders should gear up for a breakout should the price surpass 1.33800, warranting a buying action. However, a fall below 1.33400 could signal possible retracement, suggesting prudent trade adjustments. Keeping an eye on the chop zone and Keltner channel breakouts will provide key insights for your trading strategy.
1-Week, 1-Day, 4-Hour Time Frame Analysis:
In the 1-week time frame, prices indicate a gentle upward trend. The 1-day time frame suggests potential double tops, signaling caution among traders. The 4-hour time frame is showing strong support at the lower price range, reflecting buyer enthusiasm.
Based on this multi-time frame analysis, the potential entry points, along with expected profit zones, can be outlined as follows:
- Buy Entry Point: 1.33900, Take Profit Point: 1.34250, Stop Loss Point: 1.33350.
- Sell Entry Point: 1.33350, Take Profit Point: 1.33000, Stop Loss Point: 1.33550.
Overall, the likelihood of a Buy scenario appears stronger, especially with the upward pressure indicated by recent patterns. Traders should remain vigilant and adapt quickly based on price movements around these critical levels.