USD/CAD Exhibits Bullish Momentum On The Hourly Chart: An Opportunity or a Caution? – 08/05/2025
Tháng 5 7, 2025
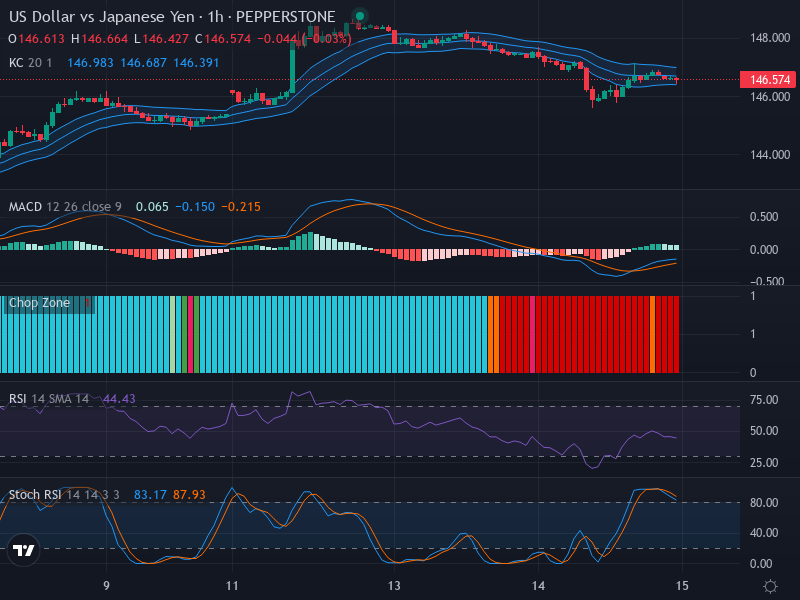
Bullish Momentum Predominates USD/JPY Forex Pair: A Comprehensive Technical Analysis – 08/05/2025
Tháng 5 7, 2025Market Overview
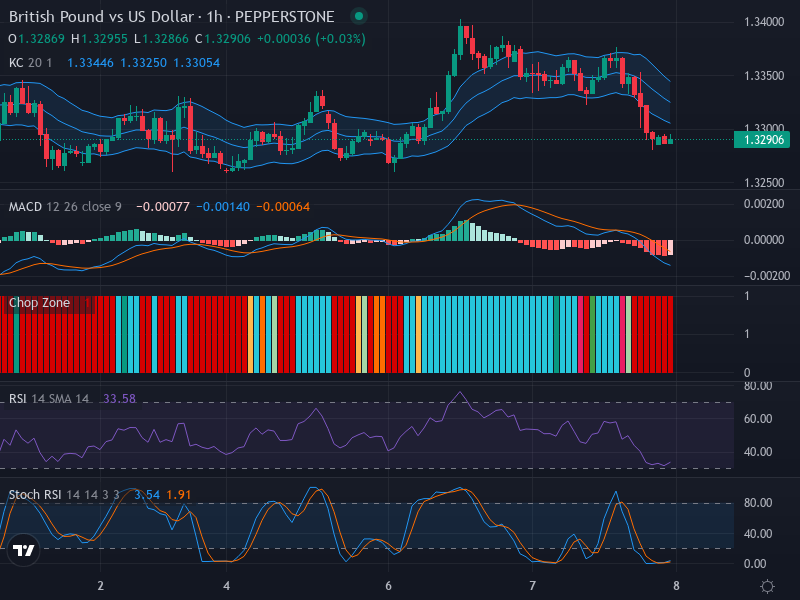
Our analysis focuses on GBP/USD, a currency pair that’s currently exhibiting a lateral movement with a slight downtrend. At the present moment, the currency exchange rate is at approximately 1.32906. Despite the lack of significant bullish or bearish candlestick patterns such as hammers or dojis, the chart points at a strong possibility for potential overdue shifts in market activity.
Technical Analysis
Analyzing the candlestick patterns on the chart, we find no visible indication of a pronounced reversal signal, suggesting a continued lateral and slightly downward motion for the currency pair in the short term.
One of the regions to watch closely is around the 1.32800 mark. This particular level has consistently exhibited substantial trading activity in the past, making it a potential area of interest for price surges or retracements in the future.
Delving into the Relative Strength Index (RSI), a popular momentum oscillator, we note a reading of 33.58. Although this value is inching towards the oversold territory (below 30), it has not yet fully crossed into this region. This movement points to existing selling pressure, but also indicates a scope for reversal should the buying pressure surge. In line with this, no clear divergence is detected from the RSI analysis at this stage.
The Stochastic RSI, another key momentum indicator, presents an interesting observation. The K line value (3.54) is currently positioned above the D line value (1.91). This crossover is widely interpreted as a possible sign of an impending bullish reversal. Furthermore, the low Stochastic RSI values and the marginal upward movement of the K line denote that the currency pair could be in position for a reversal.
Conclusion and Trading Recommendations
The GBP/USD pair is presently showcasing a lateral movement with a slight bearish bias. However, several indicators suggest that it may be ripe for a reversal. The Stochastic RSI hints at a potential bullish reversal, mostly due to its values and the crossover of the K line over the D line. Moreover, the RSI seems to be moving towards the oversold region, another indicator of a possible reversal.
In light of these observations, traders should proceed with caution and closely monitor the noted key levels and indicator trends. While holding on to sell positions could be lucrative in the short run, traders might want to prepare to capitalize on the anticipated reversal.
Trend Analysis by Time Frame
- The 1-week timeframe indicates a sustained bearish trend, with the potential for a reversal on the horizon as key indicators align.
- In the 1-day timeframe, the momentum shows mixed signals with a slight downward bias, yet there are hints of possible upward movement as indicated by the Stochastic RSI.
- On the 4-hour timeframe, the market appears to be consolidating around key levels, suggesting a critical moment for traders to determine their positions, with signals pointing towards potential volatility.
Potential Entry Points
- Buy Scenario: Entry point is at 1.3300, with a take profit set at 1.3350 and a stop loss at 1.3270. This setup allows for capitalizing on a bullish reversal while limiting potential losses.
- Sell Scenario: Entry point at 1.3280, with a take profit set at 1.3250 and a stop loss at 1.3295. This option might be suitable if the current downward pressure continues.
From the comprehensive analysis of the indicators and market behavior, it appears that a Buy scenario may have a higher likelihood of unfolding, especially considering the bullish signals suggested by the Stochastic RSI and the nearing oversold status of the RSI.