Forex Market Analysis: USD/JPY Experiences Downward Pressure – 16/05/2025
Tháng 5 15, 2025
Decoding the DoD Audit Crisis: Why Accountability Matters More Than Accounting
Tháng 5 16, 2025Market Overview
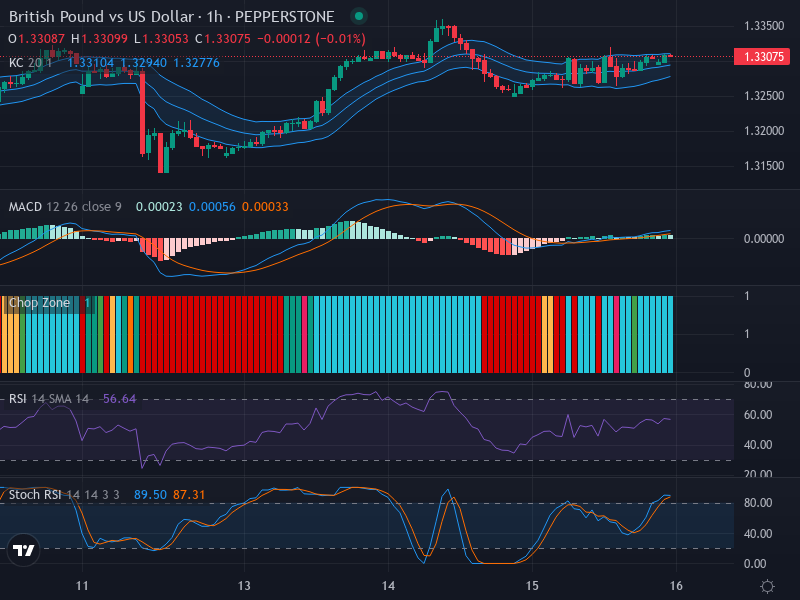
The British Pound against the US Dollar (GBP/USD) is currently exhibiting consolidation market behavior, following periods of minor price fluctuations. At its current forex rate of 1.33075, the broad market sentiment reflects uncertainty from the lingering indecisiveness of investors. The outlook remains somewhat blurry, potentially pointing to a heightened potential for both upward and downward price actions.
Technical Analysis
The GBP/USD Forex pair, in recent trading sessions, presents an interesting pattern of small-bodied candlesticks. This type of market movement typically signifies a tug-of-war between market bulls and bears, leading to the formation of a consolidation zone. The pair is largely moving sideways with crucial price levels indicated at 1.3335 for possible breakouts and 1.3250 for potential retracements.
The underpinnings of this consolidation trend reflect through key technical indicators. Currently, the GBP/USD witnesses a neutral Relative Strength Index (RSI), registering a value of 56.64 that courses slightly towards bullish sentiment but without any significant divergence with the price.
The Stochastic RSI, however, presents a more intricate picture. With the K line at 89.50 and the D line at 87.31, it sends a signal of a currency pair in the overbought territory. Although there seems no clear crossover just yet, the indication of a potential slowdown in the asset’s upward drive is noteworthy.
On the MACD front, the situation is predominantly bullish, albeit weakly so. The MACD line intersects softly above the signal line at a value of 0.00023. The histogram, in parallel, reflects insignificant momentum, corroborating the insinuated weak bullish crossover.
Conclusion and Trading Recommendations
Given the current technical picture, GBP/USD appears to be in a phase of indecisive market swings. Traders are advised to be vigilant of the 1.3335 and 1.3250 marks, which, if breached, could lead to a significant directional change. At present, it is judicious to adopt a wait-and-see strategy until clearer signals emerge.
Long positions may be considered should the pair break convincingly beyond 1.3335, with a subsequent confirmation of upward momentum in indicators like RSI and MACD. Conversely, traders may consider short positions on confirmed retracements towards the 1.3250 level, especially if the overbought state of Stochastic RSI translates into downward momentum.
Short-term Time Frame Analysis
In analyzing the 1-week, 1-day, and 4-hour time frames, we can infer some crucial trends:
- 1-week: The trend remains neutral, with the possibility of breakout signals on either side depending on upcoming economic data releases.
- 1-day: Price continues to hover around key resistance and support levels, indicating potential volatility.
- 4-hour: The sentiment shifts towards bearish as recent movements indicate potential reversals at resistance levels.
Based on this analysis, potential trading points are identified:
- Buy Entry Point: 1.3340, Take Profit Point: 1.3400, Stop Loss Point: 1.3300.
- Sell Entry Point: 1.3240, Take Profit Point: 1.3200, Stop Loss Point: 1.3260.
Considering the current market dynamics and technical indicators, the Buy scenario appears more plausible, given the existing bullish pressures, provided there’s a confirmation of upward momentum at the breakout level.