
April 2025 Consumer Sentiment Index Falls: Understanding the Decline and Its Causes
Tháng 4 25, 2025
FBI Investigation of Judge Hannah Dugan: A Controversial Courtroom Affair
Tháng 4 25, 2025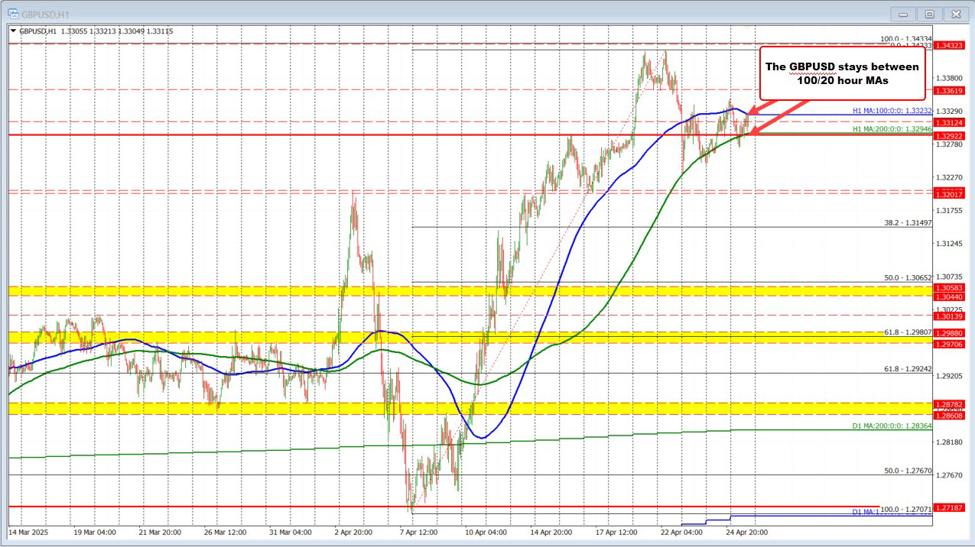
GBP/USD Technical Snapshot: Current Trends and Key Levels
Market Overview
As traders closely monitor the GBP/USD currency pair, recent movements illustrate a robust bearish control as sellers exert pressure on the currency pair below the critical 100-hour moving average (MA), positioned at approximately 1.3324. The ongoing dynamics reveal a challenge for the pair, with overnight lows dipping below this key level, thereby solidifying seller dominance in the short term. The struggle between buyers and sellers has created a compelling narrative in the forex market, which merits a deeper examination. For further insights into the current state of the GBP/USD currency pair and strategies, you may refer to this market analysis on GBP/USD.
Resistance and Support Levels
In the current trading landscape, the GBP/USD pair is confronted by significant resistance levels. The immediate resistance is marked by the 100-hour MA at 1.3324, alongside the threshold of 1.3292, which corresponds to prior highs. These levels now serve as near-term barriers that buyers must overcome to reverse the prevailing bearish sentiment.
Conversely, traders should note the critical support zones that lie ahead. The 200-hour MA, situated around 1.3253, along with the swing area at 1.3201, are pivotal downside targets in this evolving scenario. A breach below these support levels could signal an intensified downward trend, raising concerns about additional losses for the GBP/USD pair.
Recent Market Volatility
The volatility surrounding the GBP/USD pair has been noteworthy, showcasing a 0.766% intraday range, amounting to 1.010 pips amid a technical tug-of-war between buyers and sellers. This level of volatility is indicative of the unpredictable nature of the current market, with the average weekly volatility recorded at 0.590%. Such fluctuations are common in scenarios where market sentiment is divided and traders are weighing their positions carefully.
Contrasting Signals and Market Sentiment
Interestingly, the current technical indicators present contrasting signals. While short-term moving averages and the Moving Average Convergence Divergence (MACD) indicator hint at bullish potential in the market, the reality appears more complex. The failure of the GBP/USD pair to sustain levels above 1.3320, specifically the rally peak from April 24, has kept bearish forces actively engaged. Additionally, pivot-top sell signals generated on April 21 highlight the challenges faced by the bulls in sustaining momentum.
In summary, the technical landscape of the GBP/USD pair suggests a tug-of-war between bearish and bullish forces. As traders navigate these turbulent waters, both resistance and support levels will remain in focus. A vigilant eye on the price action, alongside the interplay of technical indicators, will be essential for gauging the potential direction of this dynamic currency pair. For prospects on other currency pairs, including the USD/CAD, refer to this market outlook. Staying informed and adaptable will be crucial for capitalizing on upcoming trading opportunities in the fluid forex market.