Navigating the Mixed Signals: An In-depth Analysis of the EUR/USD Currency Pair – 31/03/2025
Tháng 3 31, 2025
Analyzing USD/JPY: The Bear Trend & Near-term Correction Possibility – 31/03/2025
Tháng 3 31, 2025Market Overview
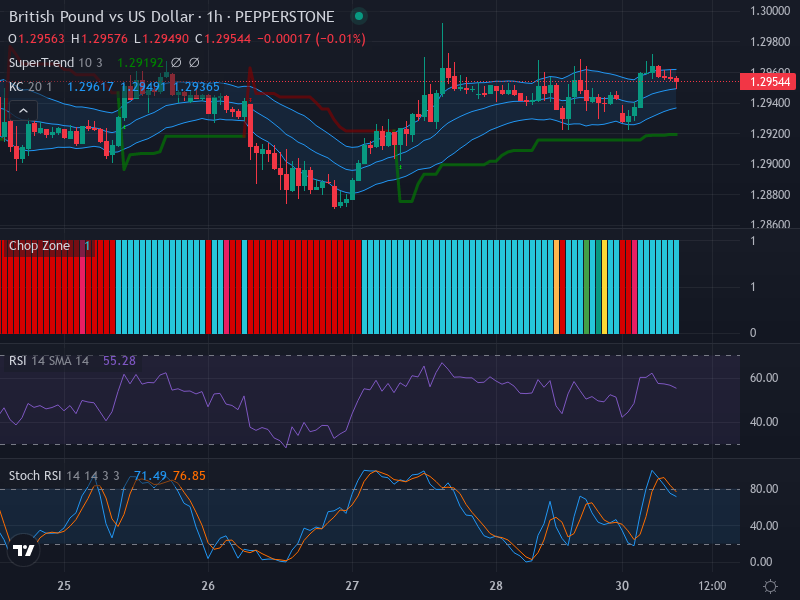
The British Pound (GBP) is currently trading against the US Dollar (USD) in a consolidated, sideways movement with no clear dominance of either a bullish or bearish trend. This depicts market uncertainty with the GBP/USD pair, possibly due to the interplay of multiple global economic factors and forex market dynamics.
Technical Analysis
The GBP/USD chart reveals a lateral price movement depicting the lack of a clear directional bias from market participants, with neither bearish nor bullish patterns dominating. The currency trading pair has identified potential resistance and support levels at 1.29800 and 1.29200, respectively. Forex traders are advised to closely monitor the price action for a breakout above or below these critical zones as they could stimulate significant price surges or pullbacks.
Delving into the oscillator analysis, the Relative Strength Index (RSI) stands at a neutral point of 55.28. This neither overbought nor oversold position of the RSI supports the sideways market scenario inferred from the price action study. The RSI trend shows no significant divergence, coherently underlining the lack of substantial buying or selling pressure.
Inspection of the Keltner Channels demonstrates that the price is hovering around the midline of the 20 EMA channel, further substantiating the absence of a dominant trend. The Chop Zone indicator further emphasizes the consolidation phase, exhibiting a dominance of colored bars, indicative of range-bound market conditions.
The Stochastic RSI scrutiny brings to light a slightly bullish momentum with values of 71.49 and 76.85 for K and D, respectively. However, the absence of a decisive crossover between these two lines limits the strength of the bullish momentum, further solidifying the market’s current state of non-directionality.
Conclusion and Trading Recommendations
Based on the gathered analysis, the GBP/USD forex pair reveals a neutral to slightly bullish movement with no clear trend for the upcoming week, demonstrating consolidation over the 1-day and 4-hour time frames. Thus, investors can look to capitalize on possible price shifts that breakout from the current sideways trend.
Trend Analysis:
In the 1-week time frame, the trend remains neutral, indicating that traders should cautiously watch the price movements around the established support and resistance levels. The 1-day analysis reinforces the sideways movement, revealing no significant pressure for either buyers or sellers. In the 4-hour timeframe, the slight bullish momentum suggests a potential upward movement; however, entry points require careful consideration at the 1-hour mark.
Should businesses or individuals have exposure to GBP/USD movements, hedging strategies might be advisable during this uncertain phase to mitigate undue risk. As always, monitoring the price action in conjunction with important market updates and economic releases can provide valuable inputs for making informed trading decisions.
Potential Entry Points:
- Buy Entry Point: 1.29550, Take Profit Point: 1.29850, Stop Loss Point: 1.29350.
- Sell Entry Point: 1.29050, Take Profit Point: 1.28800, Stop Loss Point: 1.29250.
To summarize, while slight bullish momentum exists, the overall trend remains uncertain with significant potential for both buy and sell scenarios. Careful monitoring and responsive trading strategies will be essential in navigating this market phase.
Risk Disclaimer
All opinions, news, research, analyses, prices, or other information contained in this report are provided as general market commentary. It does not constitute investment advice. Forex trading involves substantial risk of loss and is not suitable for all investors. Always conduct your own independent research before making trading decisions.