
USD/JPY Forex Chart Analysis: An Upward Trend Encounters Resistance – 02/05/2025
Tháng 5 1, 2025Navigating Tariff Talks: Key Insights into Japan-US Trade Negotiations
Tháng 5 1, 2025Market Overview
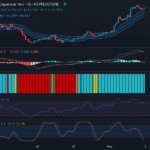
The currency pair British Pound vs US Dollar (GBP/USD) currently trades at 1.3284. Amidst increasing global financial uncertainties, the market seems to lean downward, as signaled by numerous bearish candles on the chart.
Technical Analysis
The GBP/USD pair portrays a predominantly bearish trend without any significant candlestick reversal signals. It appears that there’s no strong bullish engulfing formation or other reversal indicators that could interrupt the trend at present. The markets anticipate that the pair could approach the 1.3300 level, which corresponds to the upper boundary of the Keltner channel. It is possible that the currency pair will experience a short retracement to this point before it carries on with its downward journey.
The Relative Strength Index (RSI), with a current value of 43.11, seems to be riding the neutral territory. Neither encroaching the overbought nor the oversold zone, it hovers closer to the oversold area, slightly endorsing the bearish outlook. There are no visible divergences between the RSI values and the recent price actions, which means the RSI is implicitly backing the prevalent downward trend rather than opposing it.
In close tandem, the Stochastic RSI (K: 35.46, D: 30.14) also hovers in a neutral to oversold region. This indicator is yet to provide any clear sign of a decisive crossover that might signal an impending reversal. Therefore, for the time being, it seems to be in harmony with the bearish undertones.
Relatedly, the Moving Average Convergence Divergence (MACD), a momentum oscillator, currently shows the MACD and Signal lines entwined around zero. This proximity suggests a lack of strong directional momentum, which is often prevalent during periods of consolidation or indecisiveness. The declining histogram bars indicate a reduction in bearish momentum, however, it’s still insufficient to suggest a strong bullish reversal.

Conclusion and Trading Recommendations
In conclusion, the indicators and chart patterns for the GBP/USD pair point towards the potential continuation of a downward trend. Despite some evidence of waning bearish momentum, there is currently no significant sign to suggest an imminent trend reversal.
Traders are advised to monitor the pair for potential shorting opportunities, especially if prices retrace towards the 1.3300 mark and show signs of bearish reversal. As always, this should be done with caution and proper risk management strategies, given the uncertain market conditions.
Risk Disclaimer
This research does not constitute investment advice. Forex trading is a high-risk venture and may not be favorable for all traders. Please conduct your own due diligence and consult with a licensed financial advisor before proceeding with any trading strategy. It’s crucial to understand and acknowledge the financial risks involved before engaging in the forex market.
Trading Insights Based on Time Frames
- 1-Week Time Frame: The trend remains bearish, indicating potential continuation with lower highs and lower lows. Indicators suggest limited upward momentum, affirming the inclination for sustained selling pressure.
- 1-Day Time Frame: The bearish bias prevails, with the price approaching key resistance at 1.3300. Any rejection from this level could prompt further downward movements.
- 4-Hour Time Frame: A slight consolidation phase is apparent, but the overarching sentiment remains bearish. Traders should prepare for potential short positions, coinciding with expected resistance near 1.3300.
Potential Entry Points
- Buy Entry Point: 1.3300, Take Profit Point: 1.3350, Stop Loss Point: 1.3270.
- Sell Entry Point: 1.3280, Take Profit Point: 1.3200, Stop Loss Point: 1.3300.
Based on the current analysis, a Sell scenario is more likely, given the overall bearish indicators and resistance at 1.3300.


