
Neutral Bias Hints at Short-Term Consolidation in the USD/CAD Pair – 05/05/2025
Tháng 5 4, 2025
Foreseeing Potential Trends in GBP/USD: A Comprehensive Forex Technical Analysis – 05/05/2025
Tháng 5 4, 2025Hour EUR/USD Analysis: A Potential Bearish Surge
Market Overview
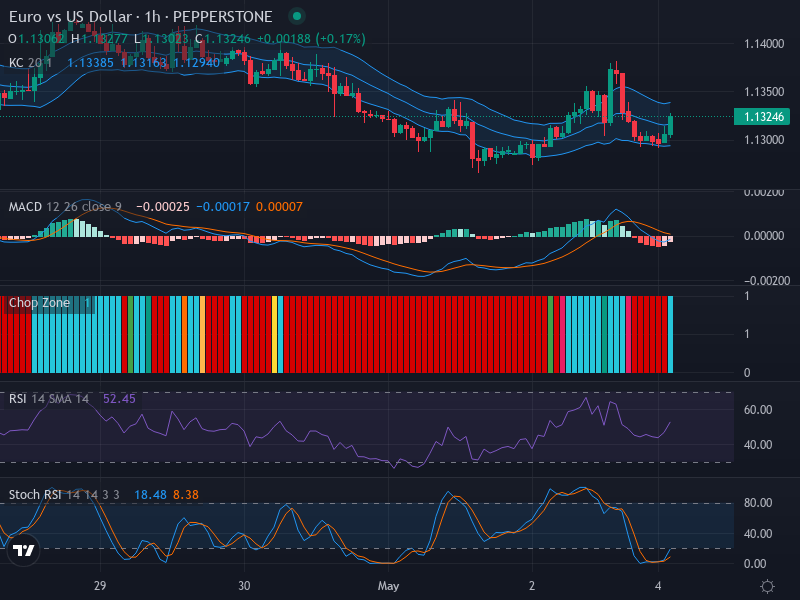
In the currency pair Euro versus the US Dollar, the market direction seems to be oscillating laterally with some bearish undertones. The analyzed candlestick pattern reveals recurring bearish candles indicating a subtle trend towards downward market pressure. Despite the current flux, price surges might occur if the support near 1.1300 maintains its stability, while retracements could appear around 1.1350 resistance level.
Technical Analysis
Understanding the chart patterns, Relative Strength Index (RSI), Stochastic RSI, Moving Average Convergence Divergence (MACD), and potential market moves provide a detailed insight into the market’s expected performance.
Most evidently, the sequence of accumulative bearish candles indicates potential selling pressure which is suggestive of the existence of a downward trend. This downward pressure on the market is expected to continue considering the slightly bearish crossover of the MACD line underneath the signal line.
Diving deeper into the RSI analysis, the current value stands at a median of 52.45 and agrees with a lateral to bearish trend, without a clear divergence from price movement. This suggests a balanced market condition with neither the buyers nor the sellers being in complete control.
In parallel, the Stochastic RSI provides a key hint towards potential oversold conditions. With both K Line value at 18.48 and the D Line value at 8.38, both lines fall below the 20 threshold, an indicator typically suggestive of an oversold market.
The MACD analysis also seems to echo the assumption of potential downward pressure. With a slightly bearish MACD and signal line crossover, coupled with a flattening histogram, the momentum seems to be tapering off.
Conclusion and Trading Recommendations
In sum, a neutral to slightly bearish sentiment is dominating the EUR/USD currency pair. If the support at 1.1300 continues to hold, traders could witness interim price surges; however, retracements are likely to be seen near the 1.1350 resistance.
Considering the above technical analyses, traders could potentially adhere to a cautious and watchful approach until a clearer trend emerges. Inherited with the charm of the forex market, the neutral state could at any time take a swing either towards the bearish or bullish direction. Therefore, traders are advised to wait for confirmatory signals before taking a position in the market.
Trend Analysis for Different Time Frames
Upon analyzing the 1-week, 1-day, and 4-hour time frames, here are the trends observed:
- 1-week: The market indicates a bearish trend as selling pressure persists, with resistance consistently holding strong.
- 1-day: The analysis suggests that while there are some signs of potential recovery, the prevailing sentiment remains bearish with lower highs forming.
- 4-hour: A clear downtrend from recent highs is visible; the price has failed to hold above critical moving averages.
Based on this multi-time frame analysis, the potential entry points at the 1-hour time frame are as follows:
- Buy Entry Point: 1.1310, Take Profit Point: 1.1345, Stop Loss Point: 1.1290.
- Sell Entry Point: 1.1295, Take Profit Point: 1.1260, Stop Loss Point: 1.1305.
Given the analysis across different indicators and trends, it appears that a Sell scenario is more likely to occur, especially if the support at 1.1300 does not hold firm.


