Governor Wes Moore Vetoes Maryland Reparations Bill: A Shift Towards Action
Tháng 5 20, 2025
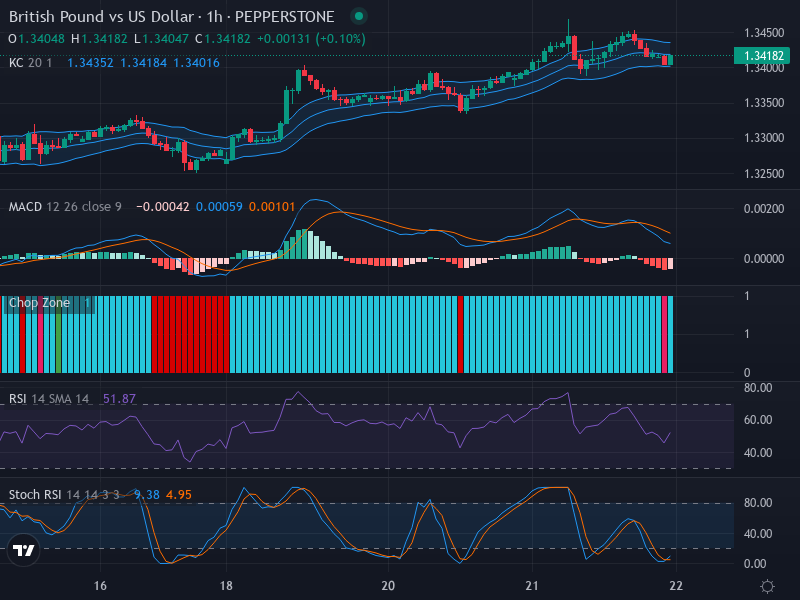
GBP/USD Navigates in Bullish Territory Amidst Strong Trending Forces – 21/05/2025
Tháng 5 20, 2025In today’s fast-paced financial markets, Forex technical analysis remains a crucial tool for traders aiming to navigate the complexities of currency fluctuations. As we delve into the current market landscape on May 21, 2025, it’s essential to break down the prevailing trends and indicators that can guide trading decisions.
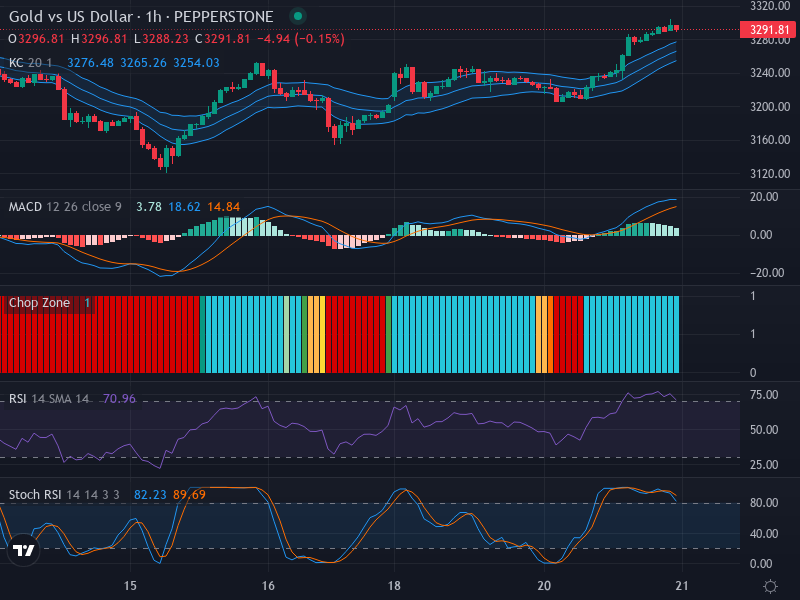
At the forefront of our analysis are popular technical indicators such as Moving Averages and Relative Strength Index (RSI). Moving Averages help to smooth out price data by creating a constantly updated average price. This allows traders to identify the direction of the trend over time. Meanwhile, the RSI, which measures the speed and change of price movements, indicates whether a currency is overbought or oversold, providing insight into possible reversal points.
Today, the currency pairs we are observing present varying signals. For example, the EUR/USD has shown a consistent upward trend on the weekly charts, suggesting bullish sentiment. However, as we zoom into daily and hourly charts, we notice fluctuations that reflect market volatility, impacted by recent economic data releases and geopolitical events.
Looking toward the 1-week timeframe, we see a clear upward trend. The moving averages are signaling a strong bullish outlook, as recent price actions consistently stay above the key moving averages. In the 1-day timeframe, however, the momentum appears to be slowing down, with the RSI indicating that the pair may be approaching an overbought condition, suggesting a possible pullback soon. In the 4-hour timeframe, price actions are more erratic, oscillating between support and resistance levels, indicating indecision among traders.
Combining insights from these timeframes, we can derive potential entry points for traders looking to capitalize on these market movements. The 1-hour timeframe appears to be optimal for pinpointing exact entry strategies. Traders may consider a Buy entry point at 1.1200, with the expectation of reaching a Take Profit zone at 1.1250, while placing a Stop Loss at 1.1170 to manage risk effectively. Alternatively, a Sell entry point could be established at 1.1180, with a Take Profit target of 1.1130 and a Stop Loss set at 1.1200.
In conclusion, analyzing the recent trends across multiple timeframes yields the following insights: the 1-week timeframe indicates a strong bullish trend, the 1-day timeframe suggests potential volatility and a need for caution, while the 4-hour timeframe reveals indecision. Given these dynamics, the scenario leans towards a potential Buy, especially with supportive indicators and market sentiment favoring an upward movement. However, traders should remain vigilant for shifts in market sentiment that may prompt alternative actions.