
USD/CHF Currency Plunge: Key Insights and Economic Drivers Behind the Shift
Tháng 4 10, 2025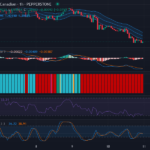
Analyzing Bearish Momentum in the USD/CAD Forex Market – 11/04/2025
Tháng 4 10, 2025In today’s fast-paced Forex market, technical analysis remains a crucial tool for traders seeking to navigate the complexities of currency fluctuations. As we analyze the current market trends, it is essential to understand key concepts and tools that will inform our decisions.
Technical analysis revolves around the study of past market data, primarily focusing on price and volume, to predict future price movements. At the heart of this methodology are charts, which visually represent price variation over time. Common charts include line charts, bar charts, and candlestick charts, with candlestick patterns being particularly popular among Forex traders due to their rich information representation.
Today’s market shows distinct trends across multiple time frames. Looking at the 1-week chart, current momentum indicates a bullish trend for several currency pairs, driven by recent economic data signals that suggest stronger-than-anticipated growth in certain regions. The price action indicates that traders should be cautious as market corrections could be imminent.
In the 1-day time frame, we observe a slight pullback from the recent peak, signaling the possibility of profit-taking before a potential resumption of the bullish trend. This situation creates an opportunity for short-term traders to capitalize on fluctuations.
The 4-hour time frame analysis reveals consolidation patterns in various currency pairs. These patterns suggest indecision in the market, as traders weigh economic news against current price levels. Volume analysis during this period indicates that a breakout could occur, but traders need to be vigilant, as volatility may increase.

In conclusion, considering all the analyses, we can summarize the trends for each time frame:
- The 1-week trend shows overall bullish momentum; however, traders should prepare for potential corrections.
- The 1-day trend indicates some price pullback, suggesting that short-term adjustments might create buying opportunities.
- The 4-hour trend is characterized by consolidation, which points to possible breakout scenarios but requires close monitoring.
From these insights, potential trading points can be identified in the 1-hour time frame. If we apply these analyses, the potential entry points are as follows:
- For a Buy entry, consider entering at 1.2100 with a Take Profit at 1.2200 and a Stop Loss set at 1.2050. This range allows for a profit zone that takes advantage of expected upward movement based on bullish signals in the longer time frames.
- For a Sell entry, traders might look to sell at 1.2350 with a Take Profit at 1.2250 and a Stop Loss at 1.2400. This option capitalizes on the potential for downward corrections seen in the daily trend analysis.
Overall, considering the current market conditions and the analysis of the indicators, a Buy scenario appears more likely in the short term, with notable bullish trends supporting this outlook.


