
Anticipated Influence of Tokyo CPI Data on JPY: What’s Next?
Tháng 4 23, 2025
British Pound vs US Dollar: A Comprehensive Technical Analysis Amidst A Dominant Downward Trend – 24/04/2025
Tháng 4 23, 2025Today, we take a closer look at the latest developments in Forex technical analysis as of April 24, 2025. The Forex market is always evolving, influenced by economic data, geopolitical events, and trader sentiment. By examining these elements through charts and indicators, traders can identify potential trading opportunities.
In our analysis, we focus on the major currency pairs and employ various technical tools to interpret price movements effectively. The foundation of technical analysis lies in the study of past market data, primarily price action and volume, to forecast future trends. This approach is particularly valuable in Forex, where daily fluctuations can lead to significant opportunities for profit.
The current market sentiment appears to be relatively bullish based on recent price movements. Major pairs such as EUR/USD, USD/JPY, and GBP/USD are all showing signs of strength, with bullish patterns emerging. This suggests that many traders anticipate further upward movement in the near term.
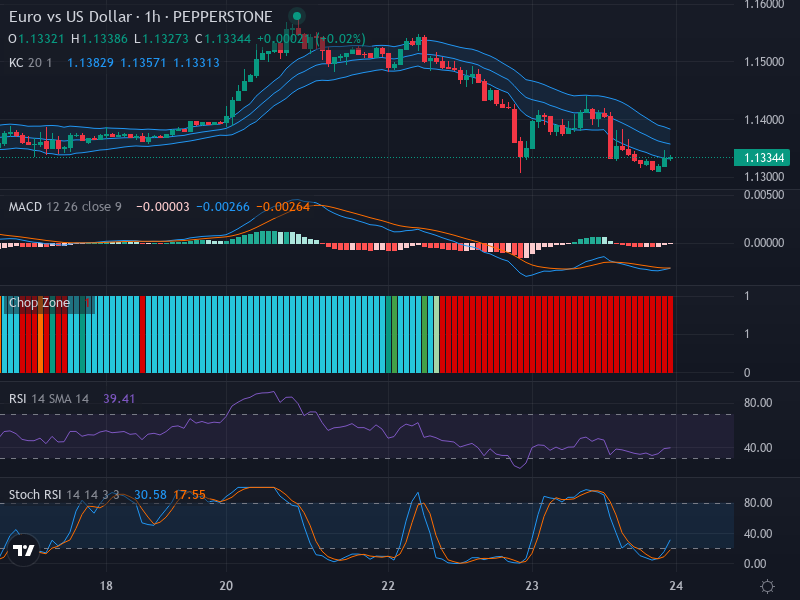
One of the key tools we use in our analysis is the Moving Average Convergence Divergence (MACD) indicator, which helps identify momentum and the strength of price trends. The MACD line crossing above the signal line typically indicates a bullish trend, while a cross below may signal a bearish trend. Currently, our MACD analysis confirms a potential bullish outlook for the EUR/USD pair.
Furthermore, the Relative Strength Index (RSI) provides valuable insights into whether the market is overbought or oversold. An RSI above 70 often indicates an overbought market, while an RSI below 30 suggests an oversold market. Presently, the RSI for key currency pairs is hovering near a balanced level, which opens up possibilities for both buying and selling depending on short-term price actions.
Through examining the 1-week, 1-day, and 4-hour timeframes, we can draw out several important observations:
In conclusion, based on our comprehensive analysis of the price movements and technical indicators, here are the summarized trends in various timeframes:
- The 1-week timeframe is suggesting a consolidation phase, with price fluctuations around key support and resistance levels.
- The 1-day timeframe indicates a strong bullish trend, supported by increasing trading volume and positive sentiment.
- The 4-hour timeframe displays signs of short-term continuation of the bullish trend, with recent price action reflecting higher highs.
Given these observations, we can identify specific potential entry points. For a Buy scenario, we may consider entering at a price level of 1.0850, targeting a profit point at 1.0900 and placing a stop loss at 1.0800. On the other hand, for a Sell scenario, we could look at an entry point of 1.0750, aiming to take profit at 1.0700 while setting a stop loss at 1.0780.
Analyzing the broader trends, the Buy scenario appears more likely given the bullish indicators and overall market sentiment. Traders should remain vigilant, keeping an eye on any news events or economic releases that might impact these trends.


