Navigating Sideways: An Insight into The Current USD/CHF Market – 27/03/2025
Tháng 3 27, 2025
Navigating the Waters: A Detailed Analysis of the NZD/USD Pair’s Consolidate and Surge – 27/03/2025
Tháng 3 27, 2025Market Overview:
The foreign exchange market showcases a lateral pattern between the Australian and US Dollar (AUD/USD), one of the most widely traded currency pairs globally. There is a slight inclination towards an upward trend as evidenced by current technical analysis. The near-term market scenario hints at tentatively bullish movements, while long-term trends remain under the influence of broader economic factors.
Technical Analysis:
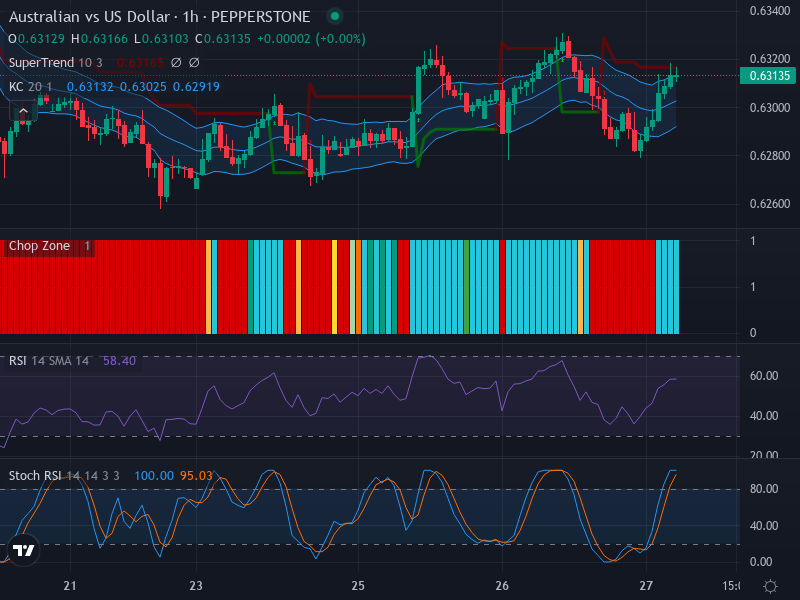
Firstly, we do not observe any significant candlestick reversal patterns such as bullish engulfing or doji on recent charts. This lack of definitive formations suggests an ongoing uncertainty in the AUD/USD pairing. At present, the currency pair presents sideways movements, oscillating with minor upward tendencies. A notable upward momentum could be anticipated if the price consistently breaches the 0.63200 resistance level. On the flip side, potential price corrections may transpire near the middle Keltner Channel line, approximately around the 0.63000 support region.
Delving into the Relative Strength Index (RSI), it currently stands at 58.40, indicating a balanced market condition, albeit slightly tilted towards bullish tendencies. The RSI reading suggests that the market is not overbought nor oversold, which further supports the potential for an imminent, short-term upward price movement.
Within the Keltner Channels, the price is straddling near the middle band, signifying a more sideways longer-term trend for the AUD/USD pair. This situation, along with a slight expansion in the channel, is indicative of some market volatility while still lacking a distinctive trend direction.
The Chop Zone further reinforces the above observations. Persistent coloration, particularly in red, suggest that the AUD/USD market has been moving sideways with low trending momentum. Consequently, as of the current technical analysis, the market does not give an unambiguous breakout signal considering that the price has not consecutively closed outside the Keltner Channels, and the Chop Zone remains colored.
Finally, the Stochastic RSI (Stoch RSI) offers an additional dimension to our research. With the K line at 100.00 and D line at 95.03, they symbolize the AUD/USD pair developing in an overbought condition.
Conclusion and Trading Recommendations:
This analysis sees the AUD/USD pair oscillating laterally with a minor inclination toward an upward movement. While one may argue that current market conditions favor short-term bullish traders, caution must be exercised due to the overbought conditions suggested by the Stochastic RSI. Therefore, traders are advised to maintain watchful scrutiny of price movements around the 0.63000 and 0.63200 markers before making any trade decisions.
Risk Disclaimer:
The information provided in this article should not be considered as financial advice but a perspective based on technical analysis. Forex trading involves substantial risk and may not be suitable for everyone. Always consult with a licensed broker or a financial advisor and understand the potential risks before engaging in forex trading.