
Examining Bullish Potential in USD/CAD Forex Market – 02/05/2025
Tháng 5 1, 2025
USD/JPY Forex Chart Analysis: An Upward Trend Encounters Resistance – 02/05/2025
Tháng 5 1, 2025Market Overview
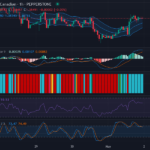
The Euro (EUR) continues to show a downward trend against the US Dollar (USD) in recent days, despite brief periods of sideways movements confirming a subdued market phase. Currently, the exchange rate is lingering around the 1.12966 level with potential for further bearish movements. However, bearish dominance is not displayed profoundly on the candlestick pattern, suggesting the market may see an upcoming minor correction or stabilization.
Technical Analysis
The latest EUR/USD chart on a 1-hour time-frame aids the observation of dominant downward market direction with occasional sideways movements. In the absence of any decisive bullish or bearish patterns like hammers or engulfing setups, the price trend appears to be taking on a more bearish sentiment, with a plausible retracement zone near the 1.13177 resistance level, as deciphered from the Keltner Channels.
The RSI, standing at 43.59, places itself in a neutral to slightly oversold range. This implies the presence of price stabilization or a possible slight corrective move upwards looming in the market. Notably, the RSI does not display any key divergence that could clarify the future price direction.
Further investigation into the Keltner Channels indicates that the price is majorly below its middle band, further corroborating the prevalent downward trend. Concurrently, the Chop Zone’s dominating red frame affirms the recent sideways market movement. It’s noteworthy that as the channel narrows, the anticipation for a breakout increases given the price spillage outside of the channel.
Similarly, the Stochastic RSI generates some intriguing signs. With the K Line at 54.48 and the D Line at 46.71, there’s a potential for a bullish crossover that could foresee a minor recovery in the market. This development suggests that the market may be readying itself for initial bullish momentum, yet conclusive evidence remains elusive at this stage.
Finally, the Moving Average Convergence Divergence (MACD) analysis hasn’t reached any conclusion yet, necessitating further observation.

Conclusion and Trading Recommendations
Given the outlined technical circumstances, traders could anticipate minor corrective bullish movements but should remain cautious given the overall downward trend. The potential for a retracement near the 1.13177 level calls for observation, while RSI and Stoch RSI indicate market conditions could become favorable for short-term buyers. For now, patience and careful market observation are advisable.
In analyzing the 1-week, 1-day, and 4-hour time frames, we find the following trends:
- The 1-week trend continues to show bearishness, with no immediate reversal signals presenting.
- In the 1-day time frame, we observe a potential weakening of momentum, hinting at a minor correction.
- The 4-hour time frame shows sideways movement, indicating indecision in market direction.
From this analysis, potential entry points at the 1-hour time frame are as follows:
- Buy Entry Point: 1.13000, Take Profit Point: 1.13300, Stop Loss Point: 1.12800.
- Sell Entry Point: 1.12800, Take Profit Point: 1.12500, Stop Loss Point: 1.12950.
Upon evaluating these scenarios, the evidence slightly favors a Buy scenario due to the possible bullish crossover indicated by the Stochastic RSI and the impending retracement zone near the key resistance level.


