
Navigating the Gold vs US Dollar Forex Market Amid Sideways Direction: A Technically-Centric Study – 15/04/2025
Tháng 4 14, 2025
Forex Market: A Mixed Climate for USD/JPY Amidst Sideways Movement – 15/04/2025
Tháng 4 14, 2025Market Overview
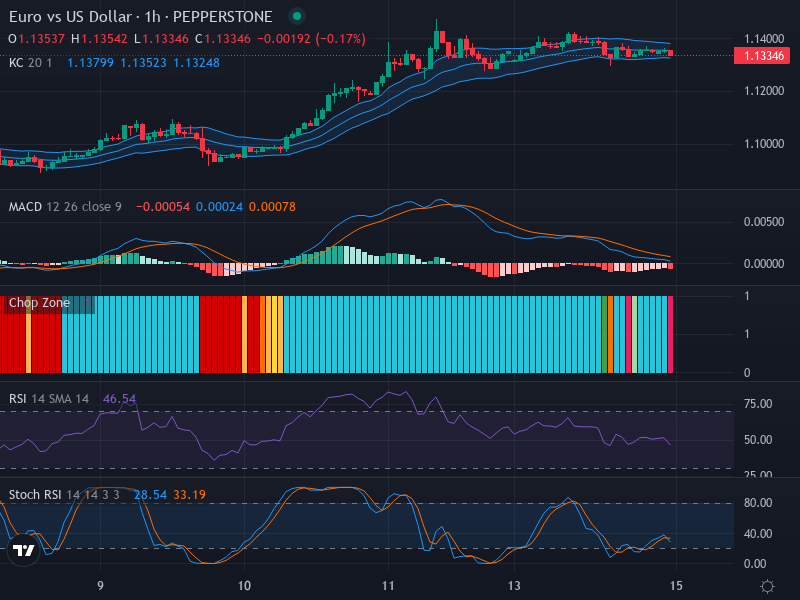
The foreign exchange market witnesses Euro vs the US Dollar (EUR/USD) demonstrate lateral oscillations, as the pair maintains proximity to the central line of the Keltner Channels. The behavior poses questions for trading decisions and potential market outlook. The current price of this pair is standing around 1.13346, with indications of impending price surges or retracements at the channel thresholds.
Technical Analysis
Candlestick Patterns and Dominant Market Direction
The absence of any prominent bullish or bearish formations in recent candlestick patterns underscores the prevailing temperate sentiment. Rather than pronounced upward or downward movement, the market seems to be caught in a lateral movement phase. This consolidation phase is especially noticeable when the price appears to hover near the median line of the Keltner Channels. With channel borders looming at 1.13799 and 1.13248, these points could become the battleground for future price surges or retracements.
Relative Strength Index (RSI) and Stochastic RSI Insights
The RSI value of 46.54, dwelling between overbought and oversold territories, reflects neutrality in the market. This lack of bias lends further substantiation to the observed lateral movement of the price action.
The Stochastic RSI reinforces this, with K and D values of 28.54 and 33.19 respectively. The position of both lines below the midpoint not only suggests dwindling downward pressure but the palpable freeze points towards a market sentiment largely unperturbed by any strong momentum.
MACD Line & Signal Cross Examination
The MACD line, currently trailing behind the signal line (-0.00054 vs 0.00024), implies a mildly bearish sentiment, yet the slim gap hints to the ongoing price consolidation. The falling bars in the histogram further reveal a weakening bullish momentum, hinting that we may be on the cusp of a transition in market sentiment.
Conclusion and Trading Recommendations
Despite the uncertainties woven by the existing lateral price movement in the EUR/USD market, the unfolding technical clues suggest a persistence of the current trend. Investors are advised to monitor the defined boundaries at 1.13799 and 1.13248 within the Keltner Channels for any significant price shifts. Mildly bearish sentiments should be taken into account, as per MACD signals. Trading decisions should be guided by the manifestation of a clear trend or definitive reversal signals.
One-Week, One-Day, and Four-Hour Analysis
- In the 1-week timeframe, the overall trend appears to show a slight bearish stance, with price action finding resistance near 1.1400.
- The 1-day timeframe continues to indicate consolidation, suggesting potential for both up and down movements without definitive bias.
- The 4-hour timeframe reveals fluctuating patterns that also support the lateral movement, reinforcing vigilance around critical resistance and support levels.
Potential Entry Points
Considering the analysis of the indicators and tools above, the suggested potential entry points are as follows:
- Buy Entry Point: 1.13450, Take Profit Point: 1.13700, Stop Loss Point: 1.13200.
- Sell Entry Point: 1.13200, Take Profit Point: 1.12950, Stop Loss Point: 1.13400.
In conclusion, given the current market movements and technical signals, a Sell scenario appears more likely due to the prevailing bearish sentiment suggested by the MACD, despite the lateral consolidation. Traders should approach with caution and readiness to adapt to potential market shifts.


