Exploring EUR/USD in Forex Market: A Comprehensive Technical Analysis – 16/05/2025
Tháng 5 15, 2025
Walmart’s Price Hikes: Tariff Challenges and Leadership Insights
Tháng 5 15, 2025Market Overview:
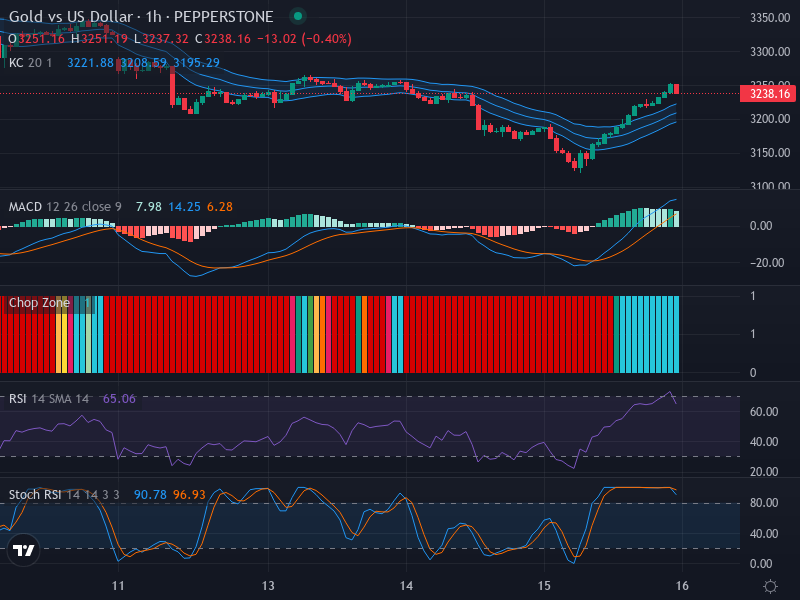
The current market landscape for the Gold vs US Dollar (XAU/USD) pair showcases an interesting scenario. At the time of this writing, the trading price is hovering around 3238.16, reflecting a strong bullish momentum that has been driving the asset’s value upwards. However, amidst this seemingly clear sky, a number of technical indicators suggest that clouds could be gathering on the horizon, signifying a potential upcoming change.
Technical Analysis:
Bullish Candlestick Formation With A Twist:
The most recent price movements, characterized by the formation of bullish engulfing candles, suggest strong upward pressure pushing the pair higher. Nevertheless, this should be viewed in the context of a potential retracement zone near 3235, which may serve as a pitstop if the market reverses, indicating a struggle for bullish forces and a shift in market dynamics.
RSI and Stochastic RSI Examination:
The Relative Strength Index (RSI) currently sits at a neutral-to-slightly overbought level of 65.06. While this RSI value primarily supports the ongoing upward trend, it raises the flag for investors to remain vigilant for a possible shift in market sentiment.
In examining the stochastic RSI, the K(90.78) and D(96.93) lines are found within the overbought territory. A subtle hint of a likely reversal is suggested by the K line’s minor movement below the D line. The presence of both lines in overbought conditions indicates an over-extension of the prevailing buying activity, raising concerns about a potential market cooldown.
MACD and Keltner Channels Signal Caution:
The Moving Average Convergence Divergence (MACD) indicator is currently positioned at 7.98, with the signal line at 14.25. This setup portrays a bearish crossover, as the MACD line sits below the signal line. The histogram showcases dwindling buying pressure, further reinforcing the argument for weakening bullish momentum.
The pair’s current positioning above the Keltner Channel’s midline suggests an ongoing upward trend. However, this should be approached with caution, considering the potential bearish undercurrents indicated by the aforementioned indicators.
Conclusion and Trading Recommendations:
While the current upward trend in the Gold vs USD market is notable, it is essential for traders to remain alert to possible signs of a market reversal. A cautious approach is advisable, maintaining a vigilant eye on the noted retracement zone around 3235. Investors may weigh a wait-and-see stance as the market clarifies its next direction.
Trend Analysis:
In analyzing the different time frames:
- 1-Week: The overall trend shows bullish strength but is beginning to falter, hinting at potential resistance.
- 1-Day: Short-term momentum appears overstretched, suggesting an imminent pause or reversal.
- 4-Hour: Indicators reveal bearish divergence, indicating weakening upward momentum and potential for a correction.
Potential Entry Points:
Considering the analysis across indicators and time frames:
- Buy Entry Point: 3240, Take Profit Point: 3270, Stop Loss Point: 3230.
- Sell Entry Point: 3235, Take Profit Point: 3200, Stop Loss Point: 3245.
Based on the convergence of indicators, a Sell scenario is more likely to occur in the immediate future.