
Forex Technical Analysis Today (05-05-2025) – 05/05/2025
Tháng 5 4, 2025
Rising Possibilities: Gold-USD Trading Outlook on Bullish Engulfing Pattern – 05/05/2025
Tháng 5 4, 2025Market Overview:
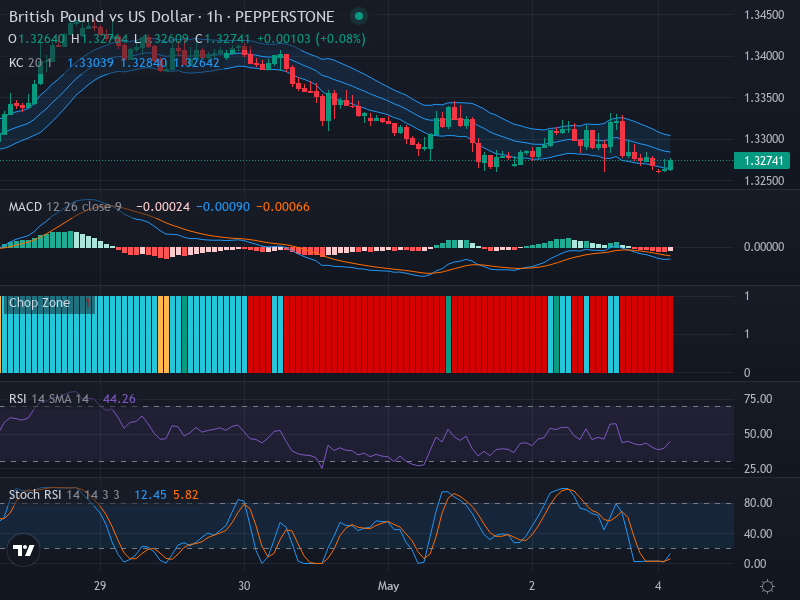
The GBP/USD currency pair, time-honored as a quintessential indicator of Forex market trends, presents an interesting case for scrutiny at present. As guided by the latest price check at 1.32741, the broader market direction for this pair indicates a downward inclination, with bearish momentum being the prevailing force.
Technical Analysis:
Investigating the candlestick patterns does demonstrate a dominantly bearish market environment. Despite the current market sentiment, it is important to note the presence of a potential retracement zone around the 1.33000 mark. This zone, if reached, could prove to be a point of resistance, which may further stimulate the downtrend upon affirmation.
On the Relative Strength Index (RSI) front, recent readings show a value of 44.26. While the RSI hovers within the neutral region, it is creeping closer to the oversold territory, hinting at a potential price rebound in the near term. Interestingly, attempts to identify clear divergence between the RSI and price action have not yielded noteworthy results.
Evaluating the Keltner Channels and Chop Zone offers further evidence of the ongoing downtrend, as the price consistently settles beneath the middle band. However, the Keltner Channels have seen a recent expansion, an event typically symptomatic of increasing market volatility. Moreover, the continual display of red bars within the Chop Zone strongly suggests the absence of a sideways trend in the immediate market outlook.
An examination of the Stochastic RSI tells a slightly different tale. With a K line standing at 12.45 and a D line at 5.82, the prospective hint of a bullish crossover agitates the bearish narrative by pointing toward an impending upward correction.
Further contradiction arises from the MACD analysis with a bullish crossover observed as the MACD line (-0.00024) eclipses the signal line (-0.00066). The histogram supports this bullish sentiment by presenting rising bars, indicative of strengthening bullish momentum.
Conclusion and Trading Recommendations:
While the overarching market sentiment for the GBP/USD pair is bearish, certain indicators suggest an imminent change in dynamics may be on the horizon. Even with a majority of evidence supporting a persistent downtrend, the potential disruptions indicated by the Stochastic RSI and the MACD analysis are significant enough to instigate watchfulness.
Traders should advocate a cautious approach, carefully observing any signs of the expected bullish crossovers to materialize. If the upward correction commences, traders could seek to capitalize on the short-term gains, whilst those with longer-term perspectives might prefer to wait for confirmation of a trend reversal.
Analysis of Time Frames:
1-Week Trend: The weekly outlook remains predominantly bearish, suggesting traders should remain vigilant for signs of exhaustion in selling pressure.
1-Day Trend: The daily chart indicates a slight increase in buying interest, hinting at a potential reversal opportunity if price action confirms.
4-Hour Trend: The four-hour signals show a possibility for a correction, although this is contingent on sustained momentum to breach key resistance levels.
Potential Entry Points:
- Buy Entry Point: 1.33000, Take Profit Point: 1.33450, Stop Loss Point: 1.32800.
- Sell Entry Point: 1.32500, Take Profit Point: 1.32200, Stop Loss Point: 1.32650.
Given the mixed signals from technical indicators, while a Buy scenario is plausible if a bullish reversal materializes, a Sell scenario remains a safe approach until clearer bullish confirmation is seen.


