
The Intricate Dance of the Euro and US Dollar: A Technical Forex Analysis – 09/04/2025
Tháng 4 8, 2025
Japan’s Strategic Commitment to U.S. Treasury Holdings Amid Trade Tensions
Tháng 4 9, 2025Market Overview
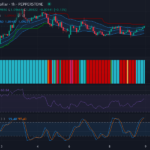
The USD/JPY currency pair is currently treading a bearish path, a trend evident in recent candlestick activities within the forex chart. The candlesticks depict smaller bodies highlighting a decline in bearish momentum. The market, however, lacks any significant bullish candlestick patterns that might suggest an upcoming reversal, such as bullish engulfing or doji. Trading has been occurring mostly within a sideways paradigm. Overall, the bearish momentum underscores the USD/JPY pair’s market dynamics, while the presence of a potential price retracement around 146.241 support offers a glimmer of slight optimism for the pair’s performance.
Technical Analysis
A closer look at the Relative Strength Index (RSI) reveals an oversold condition with an RSI value standing at 29.59. This condition could potentially fuel a price correction or even a reversal upwards, since the RSI value is below the usual 30 mark; however, there are no clear RSI divergences with the price movement, which makes this potential reversal an interesting space to watch.
Additional analysis with the Keltner Channels and Chop Zone Indicators corroborates the bearish trend. The position of the price below the middle EMA (146.663) supports this bearish sentiment, while the significantly wide Keltner Channels hint at an environment of increased market volatility. The Chop Zone’s continuous string of red bars, however, suggest a somewhat static market yet with a predisposition towards bearishness.
Applying the Stochastic RSI for further exploration offers more insights. The K line and D line values stand at 0 and -0, respectively, again indicating oversold levels. These oversold conditions could potentially trigger an upward momentum, though the lack of any observed crossovers currently indicates continued bearish momentum.

Conclusion and Trading Recommendations
Despite the bearish inclination prevalent in the USD/JPY pair, a ray of hope emerges for potential reversal based on the pair’s oversold status. The one-week timeframe shows a distinguishable long-term downward trend, but technical indicators like the RSI and the Stochastic RSI suggest that conditions might be ripe for a price retracement. Therefore, traders should monitor the pair closely over the next few trading sessions for signs of this possible reversal.
In analyzing trends across different time frames, the following points emerge:
- 1-Week Timeframe: The long-term trend remains firmly bearish with no significant bullish signals.
- 1-Day Timeframe: The market exhibits a slight potential for a retracement, but bearish sentiment remains strong.
- 4-Hour Timeframe: Bearish momentum persists, although oversold conditions can lead to a short-term bounce.
For traders considering potential entry points based on this analysis, here are some recommendations:
- Buy Entry Point: 146.241; Take Profit Point: 146.600; Stop Loss Point: 145.900.
- Sell Entry Point: 146.663; Take Profit Point: 146.000; Stop Loss Point: 146.800.
Overall, the current analysis suggests that while a Buy scenario may appear attractive due to oversold conditions, the prevailing strong Sell scenario is more likely to continue without substantial bullish confirmation.


