The Australian vs US Dollar Forex Outlook: A Refined Technical Analysis – 28/03/2025
Tháng 3 27, 2025
A Neutral Tide in the GBP/USD Current – Key Technical Notes and Strategies – 28/03/2025
Tháng 3 27, 2025Market Overview
The foreign exchange market often displays a tableau of intriguing dances between various currency pairs, and one of the most noticed duos is the Euro (EUR) and the US dollar (USD). At present, the EUR/USD pair reveals a minor, but interesting uptrend on our hourly chart, teetering at the edges of potential consolidation, showcasing the back-and-forths characteristic of the currency market.
Technical Analysis
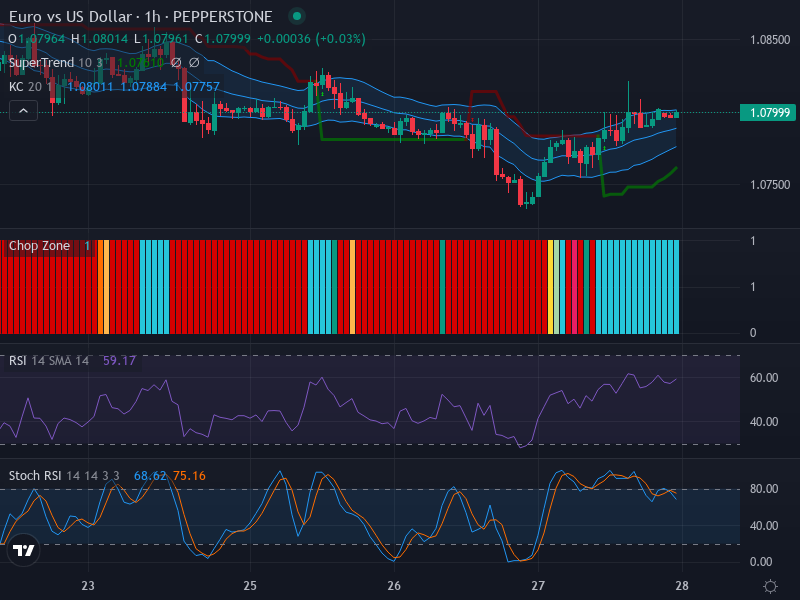
Starting with our candlestick pattern interpretation, the pair has been demonstrating a slight inclination towards the north. An absence of potent bullish cues, such as the bullish engulfing or hammer patterns, underpins the scenario of a careful climb. Nevertheless, the consistent appearance of lower wicks infers that buyers are stepping in each time a downturn threatens, thereby signifying a consistent buying pressure at the lower rungs.
Wading into the invisible boundaries that confine the price action, the pair has chalked significant zones around the 1.0810 level (resistance) and 1.0770 (support). Traders keenly monitoring the EUR/USD trajectory would do well to mark these zones for their potential impact on future chart movements.
Switching gears to an in-depth examination of momentum oscillators, we see that the Relative Strength Index (RSI) reads a value of 59.17, which denotes a neutral position slightly edging towards the overbought territory. However, it’s not necessarily a downturn signal at this point but rather a healthy corroborator of the mild upward momentum visible on the chart.
In addition to the RSI, the Stochastic RSI reaffirms this modest increase in momentum with K and D values currently at 68.62 and 75.16, respectively. There’s a hint of decelerating momentum, but presently, it still catapults the chart towards a prevailing bullish trajectory. Traders should keep a watchful eye for a potential bearish crossover that could potentially alter the chart’s course.
Lastly, the Keltner Channels and Chop Zone indicators also give a thumbs-up to our bullish trend hypothesis. The current price floats slightly above the EMA 20 middle band, further reinforcing the existing uptrend.
Conclusion and Trading Recommendations
The mild upward momentum noticed in the EUR/USD pair, coupled with the hint of potential consolidation, implies a somewhat cautious approach to trading. Buyers should make note of the resistance at 1.0810 and support at 1.0770 levels for potential breakout or bounce-back points.
Trend Analysis by Time Frame
The analysis of the EUR/USD currency pair also extends into various time frames, providing a broader perspective on the trading sentiment.
The 1-week time frame indicates a bullish tendency as long-term buyers remain active, supporting the current upward trend. In the 1-day time frame, the price action reveals a compression phase that could lead to a breakout, confirming bullish continuation. Finally, the 4-hour time frame shows a series of higher lows, further cementing the bullish scenario while hinting at short-term volatility as it nears the resistance zone.
Based on the comprehensive analysis, potential entry points for traders are identified as follows: the Buy entry point could be set at 1.0785, with a Take profit at 1.0805 and a Stop loss at 1.0770. Conversely, for a Sell entry point, consider initiating a position at 1.0805, targeting a Take profit at 1.0780 with a Stop loss set at 1.0815. Considering the prevailing bullish indicators, a Buy scenario currently appears more likely to materialize.