Nebraska Leads the Way: SNAP Benefits to Exclude Soda and Energy Drinks
Tháng 5 21, 2025
USD/JPY Analysis: Sideways Trading Offers Cautious Opportunities Amid Macroeconomic Uncertainty – 22/05/2025
Tháng 5 21, 2025Market Overview
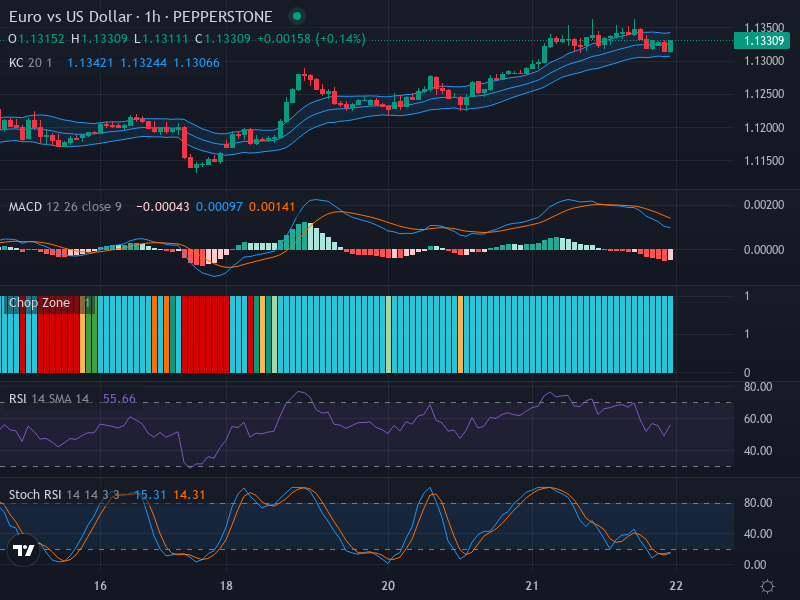
A meticulous analysis of the current currency pair (Euro/US Dollar) demonstrates an intriguing market condition. Presently, EUR/USD is exhibiting an increased bearish momentum particularly noticeable within the one hour timeframe. This overall trend, although not entirely bullish, has been experiencing a moderate upward shift recently. The pair’s current trading price stands at approximately 1.13309.
Technical Analysis
When examining the candlestick chart‘s manifestation for this trading pair, the fundamentals lean towards a slight uptrend. This subtle upward trend is backed by the closing price of recent candlesticks above the middle band of the Keltner Channel. While a firm bullish commitment isn’t yet visible on the chart, it’s noticeably clear that bearish activity has plateaued. This is reinforced by the absence of any notable market reversal patterns such as bullish engulfing or hammer formations. These factors testify the likelihood of a continuation of the current upward trend.
Diving deeper, the Relative Strength Index (RSI) for EUR/USD echoes the market’s neutrality. With a value of approximately 55.66, the index does not indicate extremes of overbought or oversold market conditions. Furthermore, there’s no distinctive divergence between RSI and price action, which further substantiates the prediction of the ongoing trend continuation.
The Stochastic RSI (Stoch RSI) reinforces the potential of an uptrend by highlighting possible oversold conditions. The entry of both K and D lines (15.31 and 14.31 respectively) into the lower range strengthens this assertion. A critical highlight is the forecasting of future upward momentum based on a possible bullish crossover within the Stoch RSI.
On the other hand, the Moving Average Convergence Divergence (MACD) paints a slightly different picture. On the surface, the MACD projects a bearish sentiment, underscored by the MACD line (-0.00043) hovering below the signal line (0.00097). Nonetheless, by taking a close look at the MACD histogram, one can discern weakening bearish momentum implying a potential shift in market direction.
Conclusion and Trading Recommendations
In light of the above analysis, the trend suggests a possible future uptick in sustainable bullish momentum. Traders should exercise vigilance and consider initiating long positions, nonetheless, it is also essential to maintain a watchful eye on potential reversal signs before trade execution. One key pointer would be a confirmed bullish crossover within Stoch RSI coupled with a reversal in MACD’s bearish trend.
Market Trend Analysis Across Timeframes
Analyzing the trend for 1-week, 1-day, and 4-hour time frames reveals the following:
- The 1-week trend suggests a bullish momentum based on a sustained rise over multiple periods, indicating a robust long-term upward trajectory.
- In the 1-day analysis, the current price action shows a consolidation phase, with prior upward movement giving traders reason to anticipate a continuation if key resistance levels are broken.
- The 4-hour timeframe reflects a mixed sentiment where temporary corrections are observed, yet overall bullish signals are emerging as recent price action attempts to break higher.
Potential Entry Points
Based on the comprehensive analysis above, here are specific potential entry points:
- Buy Entry Point: 1.13500, Take Profit: 1.14500, Stop Loss: 1.13000.
- Sell Entry Point: 1.13100, Take Profit: 1.12500, Stop Loss: 1.13350.
In conclusion, although both buy and sell scenarios present opportunities, the analysis leans towards a more likely buy scenario in the near term given the support evidenced by the indicators and the market’s subtle bullish shift. As always, careful monitoring of market conditions and timely adjustments are recommended to optimize trading strategies.