
Gold vs US Dollar: A Technical Analysis Report on Potential Market Reversal – 23/04/2025
Tháng 4 22, 2025EURUSD Market Prediction: Fear-Driven Sentiment Analysis
Tháng 4 23, 2025Market Overview
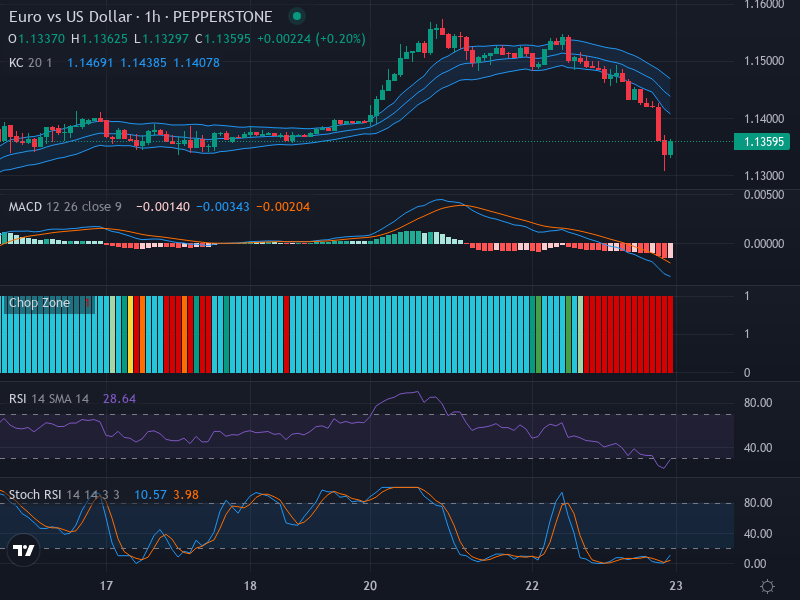
Amid the turmoil of the international currency exchange market, the Euro (EUR) and the US Dollar (USD) pair is displaying a notable bearish trend. The current exchange rate stands at 1.13595, with previous upswings consistently halted at the 1.15000 mark, forming a crucial resistance zone. The price action and market signals across multiple timeframes sketch a picture of falling prices and an overall downward trend. However, upon a detailed study, it seems that this dynamic might have a silver lining.
Technical Analysis
Our chart analysis starts with the examination of recent candlestick formations, which unfailingly manifest a robust bearish bias. Notably, a bearish engulfing pattern emerges, further augmenting the perception of an impending downside. Nevertheless, the observed bearish strength might seemingly be running its course.
The key hints of a potential turnaround or a consolidation phase come from a juxtaposition of the Relative Strength Index (RSI) and Stochastic RSI readings. Both oscillators are in the oversold territory, with the RSI at 28.64 and Stochastic RSI K and D values at 10.57 and 3.98, respectively. This oversold phenomenon indicated by both parameters is usually suggestive of an upcoming market reversal or a consolidation phase.
The bullish crossover in formation in the Stochastic RSI zone is another pointer towards the same. However, the absence of a clear divergence between the RSI and price movement shows the current direction of the market trend is coherent, hence hinting that a significant upward shift might still be a little further down the line.
The Moving Average Convergence Divergence (MACD) analysis adds another layer of depth to our study. A bearish crossover is visible, indicating that the MACD line has fallen below the signal line. However, the histogram reveals declining negative momentum, implying a possible slowing of the bearish run.
Complementing the above analysis, the Keltner Channels show that the price stands below the middle band, further validating the ongoing downward trend.
Conclusion and Trading Recommendations
Drawing from the above analysis, the market seems bearish for the EUR/USD pair in the immediate short term, with a downward trend still apparent in recent market movements. However, the oversold conditions suggested by the RSI and Stochastic RSI, coupled with decreasing bearish momentum evident from the MACD, could hint at a near-future stop to the current price slide.
Thus, while it may be prudent for traders to hold off from taking long positions just yet, closely watching the market for the hinted bullish signals might prove beneficial. The potential bounce point would be the opportune moment to take a buy position.
Time Frame Analysis
The longer-term trend over the 1-week timeframe indicates the bearish run is still valid, but signs of a potential reversal are forming as the price approaches key support levels. The 1-day timeframe exhibits consolidation just below resistance, suggesting traders remain cautious. Meanwhile, the 4-hour timeframe exhibits fluctuation with a slight inclination toward an upward shift, hinting at possible short-term bullish opportunities within a larger bearish context.
- The 1-week timeframe confirms the bearish trend but hints at a potential reversal nearing key support.
- The 1-day timeframe shows signs of consolidation, implying a hold on long positions until a breakout occurs.
- The 4-hour timeframe suggests short-term bullish potential, possibly leading into a bounce.
Given this analysis, potential entry points for traders considering a short-term outlook might be:
- Buy entry point at 1.13650, with a Take Profit point at 1.14100 and a Stop Loss at 1.13400.
- Sell entry point at 1.13400, with a Take Profit point at 1.13000 and a Stop Loss at 1.13600.
In evaluating these opportunities, the potential for a Buy scenario appears more likely due to the overall oversold conditions and signs indicating a possible market bounce, especially if traders act within the suggested timeframes.


