

GBP/USD Pair Sustains Bullish Momentum: A Comprehensive Analysis – 11/04/2025
Tháng 4 10, 2025
Defining the Limits: The Supreme Court’s Crucial Role in Presidential Power
Tháng 4 11, 2025Market Overview
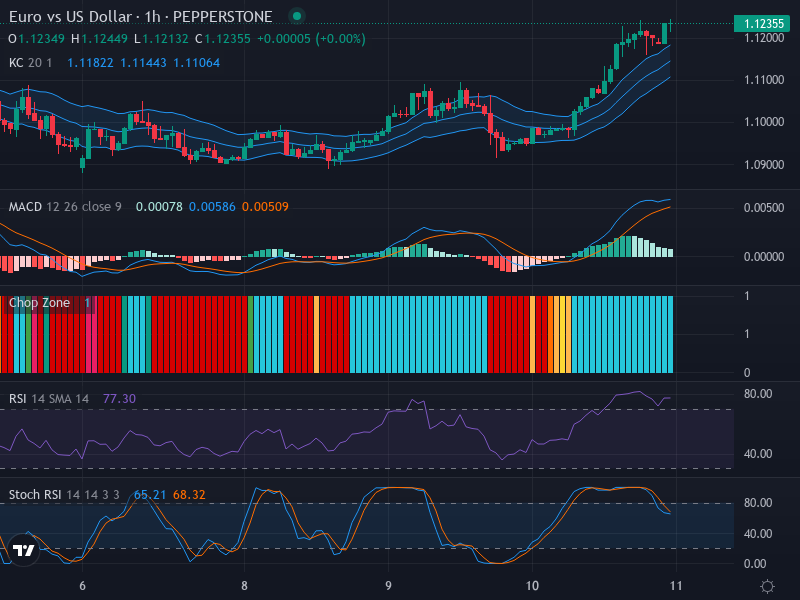
As we begin this trading week, all eyes are on the EUR/USD currency pair, which remains the most actively traded pair worldwide. Currently, the price sits at 1.12355, reflecting a robust series of bullish candlesticks that continue to drive the upward trend. While the broader market direction appears to be leaning confidently toward the north, a closer inspection of the technical indicators presents a more nuanced picture. The established ascending pattern, highlighted by potential bullish engulfing formations, suggests an extended uptrend. However, several technical elements indicate the likelihood of a retracement, creating an intriguing dynamic for traders.
Technical Analysis
Starting with candlestick patterns, the appearance of bullish engulfing formations typically signals the potential for further upward movement. This bullish sentiment aligns well with the market trend, particularly highlighting surge zones around the 1.12500 level. Yet, concurrently, a potential retracement at previous resistance levels near 1.11500 indicates mixed sentiments within the market.
Moving deeper into the analysis, the Relative Strength Index (RSI) stands at 77.30, indicating an overbought condition in the market. This high RSI reading suggests that while the dominant trend is upward, a correction may be imminent. Notably, there have been no divergences evident between price action and the RSI, further supporting a balanced analytical approach. Additionally, the Stochastic RSI shows the K line has recently dipped below the D line, hinting at a potential decline in upward momentum. This reinforces the notion of a short-term correction in response to the overbought conditions signaled by the RSI.
Turning to the Moving Average Convergence Divergence (MACD), the MACD line currently registers at 0.00078 while the signal line sits at 0.00586, with no apparent bullish or bearish crossover at this moment. However, the rising histogram within the MACD indicates an overall bullish sentiment consistent with the prevailing upward trend, minimizing the impact of any divergence at this stage of analysis.
Conclusion and Trading Recommendations
As we synthesize these various technical signals, it emerges that we are facing a dual scenario. The bullish engulfing formations and an upward-moving MACD histogram suggest the continuation of positive momentum, yet the overbought RSI combined with the potential correction indicated by the Stochastic RSI warns of the probability of a near-term reversal. Thus, traders should prepare for a possible retracement while remaining aware of the overarching bullish trend. Orders placed just above the 1.12500 mark are advisable, accompanied by stop losses positioned near the previous resistance level at 1.11500, which may act as support.
In summary, the analysis of the time frames indicates the following trends: in the 1-week time frame, the bullish trend is prevailing despite short-term overbought signals; in the 1-day time frame, the upward momentum continues but shows signs of fatigue; while in the 4-hour time frame, a correction is increasingly likely amidst high volatility levels.
Taking all these factors into consideration, potential entry points can be delineated as follows: a Buy entry point at 1.12600, with a Take profit point at 1.13000, and a Stop loss point at 1.11500. Conversely, for a Sell entry point, consider 1.11500, targeting a Take profit point at 1.11200, with a Stop loss point at 1.11800. Given the current indicators and trending analysis, scenarios leaning towards a Buy seem more favorable, albeit tempered with caution to accommodate for the potential retracement.


