Controversy Erupts as Smith College Honors Rachel Levine: A Battle Between Inclusion and Women’s Rights
Tháng 5 19, 2025
Analyzing the Potential Reversal: USD/CAD Forex Market Outlook – 20/05/2025
Tháng 5 19, 2025Market Overview
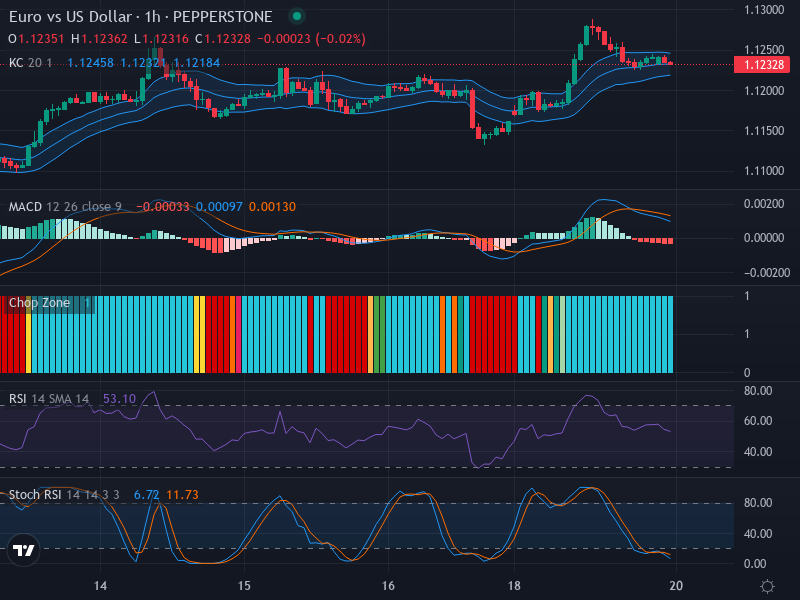
As of the most recent market close, the EUR/USD trading pair is priced at 1.12328. The currency pair’s performance showcases a mild upward trend characterized by recent peaks followed by a slight retraction, hinting at undetermined market direction for the near term. Both traders and investors are closely monitoring the interplay among supportive factors and divergent signals presented by various technical indicators.
Technical Analysis
From a candlestick pattern perspective, the EUR/USD pair seems to wade waters with a mild bullish trend, marked by previous highs and minor pullback maneuvers. Key regions to observe remain the defined resistance and support levels, noted near 1.1300 and 1.1200 respectively.
The Relative Strength Index (RSI), currently standing at a neutral level of 53.10, specifies neither an overbought nor an oversold market. The RSI movements are parallel to price activities, effectively ruling out divergences that could have otherwise lent some predictability to the price direction.
Employing Keltner Channels for evaluating volatility and trend, we find the price movement drifting around the middle band, suggesting a neutral to long-term trend. This, supplementing the Chop Zone’s red bars, indicates a sideways or “choppy” market wherein strong trends are absent. However, the slight expansion of the channels hints at potential changes in volatility on the horizon.
The Stochastic RSI analysis paints a contrast with the current mild bullish sentiment. The observed crossover of the %K value (6.72) falling below the %D value (11.73) heralds potential bearish pressure. Such a transition can underline a neutral to bearish market momentum.
Wrapping up with the Moving Average Convergence Divergence (MACD) analysis, the MACD line resides slightly beneath the signal line, opening the door for a weak bearish crossover.
Conclusion and Trading Recommendations
Given the mildly bullish trend and a mix of neutral and bearish signals from the technical indicators, traders might consider approaching the market with caution. A possibility of range-trading between the mentioned support and resistance levels might be on the cards, while keeping an eye on potential volatility spikes.
In summary:
- 1-Week Time Frame: Slight bullish trend with potential resistance at 1.1300 but also signs of weakening momentum.
- 1-Day Time Frame: Mixed signals reflecting indecision among traders as indicators fluctuate around neutral levels.
- 4-Hour Time Frame: Exhibiting a more balanced approach, hinting at possible consolidation before a breakout in either direction.
Potential entry points based on this analysis would include:
- Buy Entry Point: 1.1240 | Take Profit Point: 1.1280 | Stop Loss Point: 1.1220.
- Sell Entry Point: 1.1210 | Take Profit Point: 1.1170 | Stop Loss Point: 1.1230.
In conclusion, considering the analysis, a buy scenario might be more favorable given the mild bullish indicators, although traders should remain vigilant for sudden market changes ushered in by bearish signals.