Technical Analysis in Forex: Insights for May 23, 2025 – 23/05/2025
Tháng 5 22, 2025
GBP/USD Pair: Tides of Uncertain Market Sentiment – 23/05/2025
Tháng 5 22, 2025Market Overview
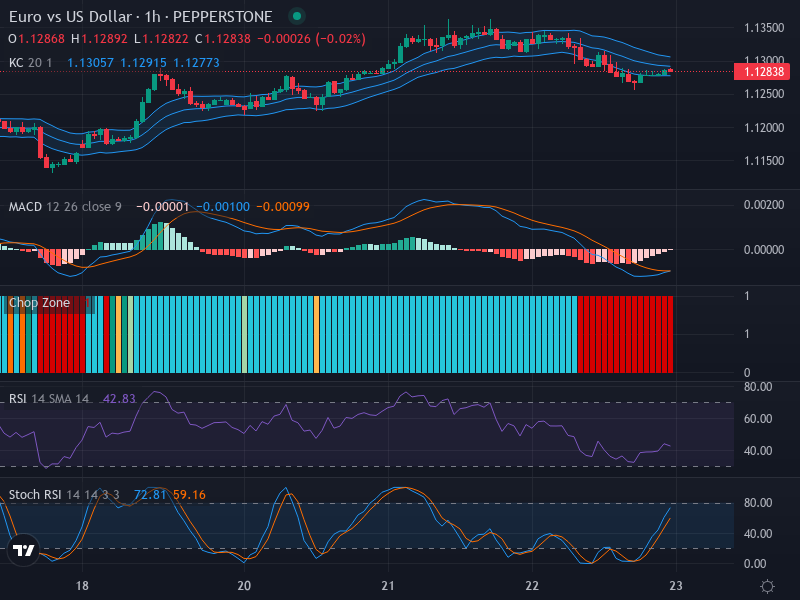
Our focal point today is the widely traded currency pair, EUR/USD. The pair is presently trading at 1.12838, reflecting a marginal bearish bias. Despite the recent downward trend, a few indicators suggest a potential shift in momentum in the Forex market. Looking closely at the pair’s performance over the past weeks, we can observe the forming of lower highs and lower lows, the classic definition of a downward trend.
Technical Analysis
The analysis will begin by examining the candlestick pattern. The presence of smaller candlesticks on the chart depicts decreased momentum and suggests a continuation of the bearish trend. Notably, traders should monitor the critical zone around 1.1250 as it holds the potential for retracement or continuation of the present trend.
Proceeding forward, let’s analyze the Relative Strength Index (RSI), which stands at 42.83, hinting towards a neutral to slightly oversold condition. Despite the ongoing bearish market, this indicates a potential for an upward correction should RSI rise.
Enhancing our prognosis with the Stochastic RSI reveals a recent crossover with the K line above the D line, at 72.81 and 59.16, respectively. This phenomenon suggests a short-term bullish breakout, albeit within the broader bearish context.
The Moving Average Convergence Divergence (MACD) analysis further complements the bearish sentiment, being close to 0 and signaling that bears have gained slight control as the MACD line is positioned below the signal line. Yet, the trend of the histogram being negative while showing weakening strength provides hope for a potential reversal.
Last but certainly not least, the Keltner Channels and Chop Zone confirm our primary trend as bearish, attributed to the price positioning beneath the center-line, or the Exponential Moving Average (EMA).
Conclusion and Trading Recommendations
In conclusion, the technical indicators cumulatively suggest that the EUR/USD is currently in a bearish phase but holds potential for a transition. Traders are recommended to carefully watch the critical zone of 1.1250 for trade confirmation and potential retracement. A combination of a rising RSI and weakening negative histogram on the MACD may signal a reversal. However, staying cautious until there is a confirmation from the MACD or a breakout recorded from the Keltner Channel will be prudent.
Time Frame Analysis
Analyzing the 1-week, 1-day, and 4-hour time frames, we observe the following trends.
In the 1-week timeframe, the overarching trend remains bearish, confirmed by sustained lower highs and lower lows. The 1-day timeframe also reflects bearish momentum, with resistance forming near 1.1350, indicating sellers are still in control. On the 4-hour timeframe, we witness a potential reversal pattern forming given the recent bullish crossover on the broader indicators, but caution is warranted due to its placement in a longer-term downtrend.
In terms of potential entry points, based on the analysis of the indicators and tools:
- Buy entry point could be established at 1.1290, with a Take profit point at 1.1325 and a Stop loss point at 1.1260.
- Sell entry point could be noted at 1.1250, with a Take profit point at 1.1210 and a Stop loss point at 1.1275.
In conclusion, although there are indicators suggesting potential short-term bullish movements, the overall market sentiment remains bearish. Hence, a Sell scenario seems more likely until a significant bullish confirmation appears.