
Breaking Barriers: U.S.-China Tariff Reductions Could Transform Global Trade
Tháng 5 12, 2025U.S.-China Trade Talks: New Mechanism Paves the Way for Tariff Negotiations
Tháng 5 12, 2025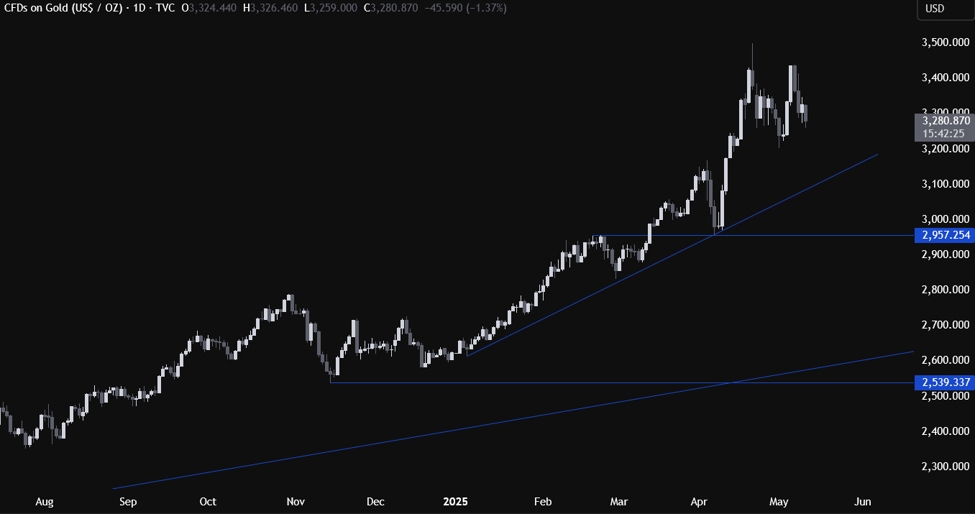
Understanding Recent Gold Market Dynamics: Technical Analysis Insights
Recent developments in the gold market reveal a complex interplay of technical indicators, market sentiment, and influential geopolitical events that are reshaping the trading landscape. This analysis will provide an in-depth look at the recent trends affecting gold prices, the underlying technical indicators, and the strategies traders can adopt in this evolving environment.
Market Sentiment and Its Impact on Gold Prices
The most significant influence on gold prices has been the atmosphere surrounding trade negotiations, especially between the U.S. and China. As optimism regarding a potential trade deal grows, market participants have shifted their focus to riskier assets such as equities and currencies. This migration has led to a notable weakening of gold’s status as a safe-haven asset. Investors typically flock to gold during times of uncertainty; however, the positive sentiment surrounding trade talks has suppressed demand, exerting downward pressure on gold prices. For a deeper understanding of this context, you can explore the dynamics discussed in this article on China’s strategic moves and its implications for trade.
Technical Analysis: Key Levels and Momentum Indicators
In the realm of technical analysis, gold has faced notable challenges. Recently, it encountered rejection after attempting to break above the formidable resistance level of $3,400. This failed attempt suggests a prevailing weakness in the market, which subsequently led to a decline below the critical support level of $3,300. Maintaining this undercurrent of bearish sentiment, market participants are closely observing pivotal levels that could dictate future price movements. Resistance levels currently sit at $3,320, $3,340, and $3,400, while essential support levels are being tested around $3,200 and $3,245. These technical parameters will be vital for traders to monitor as they indicate where upward or downward trends may solidify.
Moreover, momentum indicators have begun to reveal mixed signals. The Relative Strength Index (RSI) presents potential for a rebound, currently sitting above the midline, which could suggest a shift if market conditions align. Conversely, the Moving Average Convergence Divergence (MACD) and the Stochastic Oscillator indicate a bearish or consolidating momentum, cautioning traders against an overly bullish outlook. These indicators further underscore the complexity of the current gold market.
Navigating the Current Trading Landscape
With gold currently in a consolidation phase following some volatility, the market exhibits mixed sentiments. Traders are encouraged to closely monitor key support and resistance levels, as these will likely dictate the market’s next moves. Should gold be able to reclaim support levels, there may be room for a potential reversal; however, a failure to maintain identified support could lead to continued declines.
In conclusion, the current technical landscape of gold reflects a nuanced environment characterized by bearish signals stemming from positive trade developments and technical failures at crucial resistance points. For traders, understanding these dynamics and implementing strategies that account for the potential fluctuations in price will be paramount in navigating the challenging yet opportunity-rich gold market. Keeping a keen eye on market sentiment and the specified resistance and support levels will be essential as we move forward through this evolving trading landscape.