

Major Law Enforcement Raid Uncovers Underground Nightclub Crimes in Colorado Springs
Tháng 4 29, 2025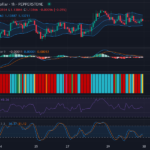
Deconstructing The EUR/USD Consolidation Phase: Next Moves Forecast – 30/04/2025
Tháng 4 29, 2025Market Overview
The British Pound (GBP) against the US Dollar (USD) Forex pair, commonly referred to as GBP/USD, is currently experiencing a phase of consolidation. After a recent upward trend, this pair has found itself trading within a narrow range, essentially oscillating sideways. This flat movement suggests a state of equilibrium in the market where buying and selling pressures appear to be in balance.
Technical Analysis
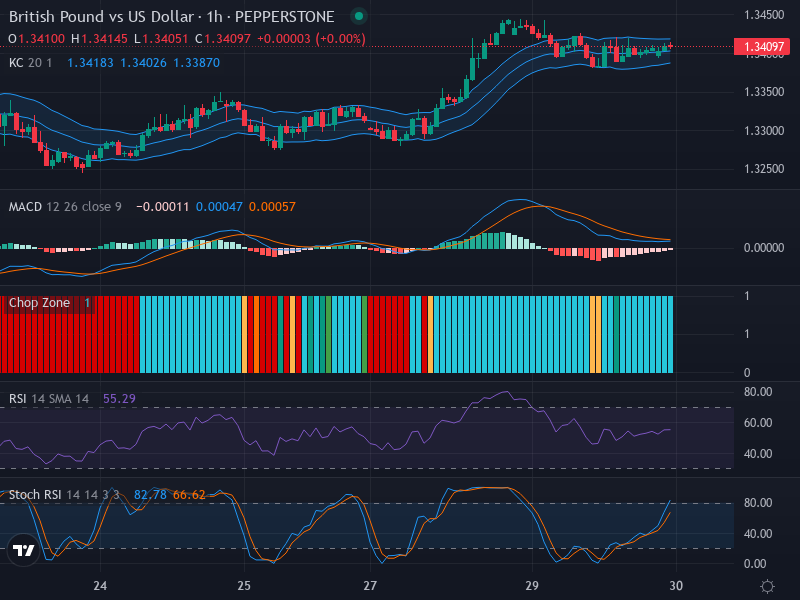
Presently, the price of GBP/USD is at 1.34097, just shy of a potential bullish breakout point. Analyzing the emerging candlestick patterns, we have observed several doji formations, which signal continued market indecision and reinforce the ongoing consolidation phase. Keeping an eye on the pivotal levels is crucial; a breakout above 1.34150 could signal a continuation of bullish momentum, while a drop below 1.33800 might indicate a shift toward bearish sentiments.
In our examination using the Relative Strength Index (RSI), currently sitting at 55.29, we see a neutral positioning with no evident signs of being overbought or oversold. This reinforces the consolidation status as the market does not display any significant divergence.
Further insights come from the Stochastic RSI, which shows a K value of 82.78 and a D value of 66.62. Here, the K line crossing above D could hint at potential bullish action. It is important to note, however, that the slightly overbought index calls for caution and confirmation before making any trading decisions.
Additionally, assessing the Keltner Channel, we find the current price situated centrally within the channel bands, supporting the lack of pronounced momentum. The presence of mildly widened channels suggests a slight uptick in market volatility. Moreover, the consistent coloring of the Chop Zone bars reinforces the prevailing sideways market conditions.
Lastly, an overview of the Moving Average Convergence Divergence (MACD) indicates that the MACD line now rests below the signal line, thereby presenting a bearish signal, cautioning traders of potential downward pressure.
Conclusion and Trading Recommendations
With GBP/USD in a consolidation phase characterized by its sideways movement, we anticipate continued quiet trading unless a price break above 1.34150 or below 1.33800 occurs. Traders should attentively watch these critical levels for viable trading opportunities.
In light of this analysis, it may be prudent for traders to remain on the sidelines until a more definitive trend is established. Should the price manage to break and hold above 1.34150, bullish trades could be warranted. In contrast, a breach below 1.33800 may present an opportune moment for shorting.
Market Trend Analysis for Different Timeframes
As a quick synthesis of the analysis:
- From the 1-week timeframe, the overall trend appears stable, with prior bullish movements but no current strong momentum.
- The 1-day timeframe supports a consolidation view, reflecting indecision among traders in the market.
- Observations from the 4-hour timeframe highlight tightening price ranges, reinforcing a waiting stance in the market before a breakout.
Potential Entry Points:
Given these observations, potential trading scenarios include:
- For a Buy Scenario: Enter at 1.34200, aim for 1.34700 as a Take Profit point, and set a Stop Loss at 1.33850.
- For a Sell Scenario: Enter at 1.33750, targeting 1.33300 as a Take Profit point, with a Stop Loss at 1.34000.
In conclusion, the market presents a mixed bag of signals; however, the potential for a bullish breakout seems promising should key resistance levels hold. Conversely, traders should remain vigilant, as a breakdown below the noted support may lead to bearish opportunities.


